
In uncertain environments, are Quality Dividend Growers the answer?
Published 9 October 2023

Head of Research, WisdomTree Europe.
2023 saw one of the narrowest bull markets in history, with only 10 stocks contributing 14.3% out of the 20.6% rally during the first 7 months of the year. Since then, markets have turned with the S&P 500 and the MSCI World dropping around -7% since their top1.
Looking forward to the rest of 2023 and beyond, uncertainty is high:
- The Federal Reserve (Fed) has reached or is nearing the end of its rate hike cycle, but the easing cycle is still distant and its speed is unknown.
- The US may avoid a full-blown recession but a recessionary environment with below-average growth is still on the table.
- Further disinflation may be slower as we get closer to target, and energy prices continue to put pressure on core CPI.
In such uncertain times, investors could be contemplating reducing risk in their portfolios. However, many of them have been caught with an underweight in equities early in 2023 and missed out on the rally, leading to underperformance. To avoid a repeat, remaining invested but shifting equity exposures toward higher quality, dividend growing companies could help protect the downside while maintaining exposure to the upside.
Quality stocks tend to outperform at the end of rate hike cycles
With the rate hike cycle reaching its end, it is interesting to see what happened historically to equities in the 12 months following the end of rate hike cycles. Figure 1 shows that the absolute performance of US equities has been quite dispersed following the end of the last 7 rate hike cycles by the Fed. US equities returned 24% in the best period and -18.8% in the worst. Looking at high-quality companies, we observe some consistency, though, since they outperformed the market in 6 out of those seven periods. The only period of outperformance was in 1998, when quality companies returned ‘only’ 23.3% versus 24.3% for the market. In the two periods when equities posted negative returns, quality companies cushioned the loss well, reducing the drawdown significantly.
Figure 1: Performance in the 12 months following the end of the Fed’s last 7 rate hike cycles
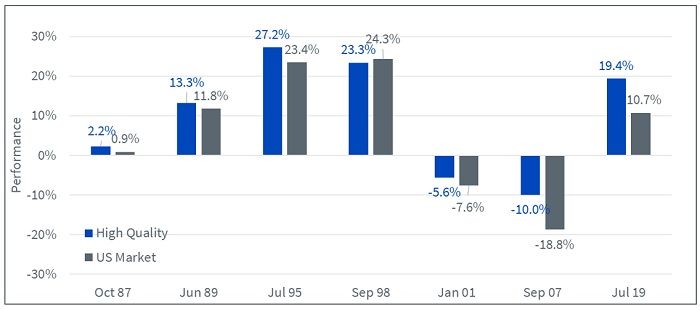
Source: Kenneth French data library. July 1963 to July 2023. Data is calculated at a monthly frequency. Stocks are selected to be above the median market cap, with 'Quality' representing the top 30% by operating profitability. The portfolios are rebalanced yearly at the end of June. The market represents the portfolio of all available publicly listed stocks in the United States. All returns are in USD. Operating profitability for year t is annual revenues minus cost of goods sold, interest expense, and selling, general, and administrative expenses divided by book equity for the last fiscal year-end in t-1. You cannot invest in an index. Historical performance is not an indication of future performance and any investments may go down in value.
When investors get picky, quality companies benefit
Figure 2 focuses on the performance of high- and low-quality stocks depending on the level of growth in the economy. We split quarters into 4 quartiles, from low-growth quartiles to high-growth quartiles, and then calculate the outperformance or underperformance of those stocks in the quarter following the growth observation.
We first observe the resilience of high-quality companies. While low-quality companies only outperform when the economy is firing on all cylinders, high-quality companies outperform in all 4 environments. High-quality stocks outperform more when growth is either low or below average.
Figure 2. Average outperformance of high-quality and low-quality companies depending on US GDP growth
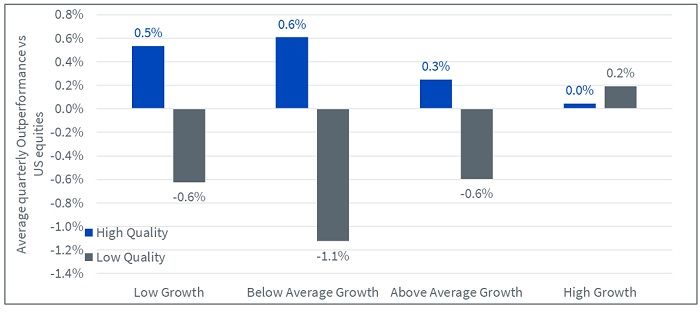
Source: Kenneth French data library. July 1963 to June 2023. Data is calculated at a monthly frequency. Stocks are selected to be above the median market cap, with 'Quality' representing the top 30% by operating profitability. The portfolios are rebalanced yearly at the end of June. The market represents the portfolio of all available publicly listed stocks in the United States. All returns are in USD. Operating profitability for year t is annual revenues minus cost of goods sold, interest expense, and selling, general, and administrative expenses divided by book equity for the last fiscal year-end in t-1. You cannot invest in an index. Historical performance is not an indication of future performance and any investments may go down in value.
The style that doesn’t go out of style
Investment factors ebb and flow between periods of relative under- and outperformance, depending on where we are in the cycle. One big exception is quality which is, in our view, the most consistent of all factors. Sure, quality can lag in the sharp risk-on rallies that typically mark the start of an early cycle snapback; but those environments don’t tend to last, and neither does quality’s underperformance. In fact, there hasn’t been a rolling 10-year period when quality underperformed since the late 1980s.
Figure 3 exhibits the rolling outperformance of different US equity factors versus the market over 10-year periods since the 1970s based on the data from a famous academic: Kenneth French. On average, over periods of 10 years, quality is the factor that has historically delivered outperformance the most, often by a significant margin (90% of the time, the second best only hit 78%). It is also the factor that exhibited the smallest worst performance.
Figure 3: Rolling 10 year annualised excess returns of US factors versus the market
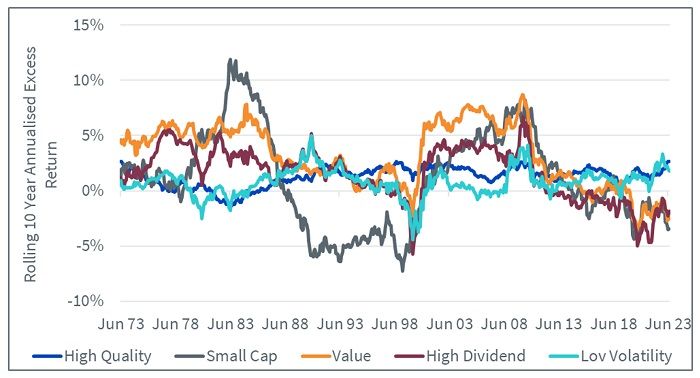
Sources: WisdomTree, Ken French, data from June 1963 to 31 July 2023 and represents the latest date of available data. Value: High 30% Book to Price portfolio. Size: Low 30% portfolio. Quality: High 30% portfolio. Low Vol: Low 20% portfolio. High Div: High 30 portfolio. Market: all CRSP firms incorporated in the US and listed on the NYSE, AMEX or NASDAQ. Historical performance is not an indication of future performance, and any investments may go down in value.
Quality Dividend Growth - a recognised quality strategy with a successful track record across regions
At WisdomTree, our Quality Dividend Growth strategies aim to leverage high quality, dividend growing companies in the most efficient way.
Our exchange-traded fund (ETF)’s portfolio is constructed around dividend paying companies with the best-combined rank of Earnings Growth, Return on Equity and Return on Assets within an ESG-filtered universe of companies with sustainable dividend policies. Stocks are risk-tested using a proprietary risk screen (Composite Risk Score), which uses Quality and Momentum metrics to rank companies and screen out the riskiest companies and potential value traps. Each company is then weighted based on its cash dividend paid (market capitalisation x dividend yield), which introduces valuation discipline in this high-quality portfolio.
Those steps deliver an all-weather strategy that can be used as a strategic holding to put time in the market. To demonstrate the ‘all-weatherness’ of high-quality dividend growing companies, and the capacity to outperform in most market scenarios, we look at the WisdomTree Global Quality Dividend Growth UCITS ETF.
- Our ETF outperformed the market in 75% of the 12-month periods since its launch in 2016.
- Out of the 1129 strategies (mutual funds and ETFs, both active and passive) that have at least as long a track record as our ETF (that is, a launch date before 7 June 2016) and that have a tracking error of at least 0.75% to the market (that is, they are not trackers of MSCI World), only five strategies have managed to outperform more often.
- This means that 1122 strategies had less consistent returns than our Quality Dividend Growth ETF.
Figure 4: Distribution of strategies depending on the proportion of 12-month periods in which they outperformed the market
Source: WisdomTree, Morningstar. Period from 30 June 2016 to 30 June 2023. Calculations are based on monthly NAV in USD. 2 peer groups are used: Global Income and Global Large Cap Blend. Performances over periods longer than a year are annualised. You cannot invest directly in an index. Historical performance is not an indication of future performance, and any investments may go down in value.
In addition to consistency and stability, the WisdomTree Global Quality Dividend Growth UCITS ETF has also outperformed the market since launch with lower volatility (14.9% which is 1.3% less than the market).
Figure 5: The WisdomTree Global Quality Dividend Growth UCITS ETF outperformed with less volatility than the market
Source: WisdomTree, Morningstar. Period from 7 June 2016 to 31 August 2023. Historical performance is not an indication of future performance, and any investments may go down in value.
Conclusion
Overall, high-quality companies have exhibited outperformance in periods of low growth, in periods following rate hikes and, more generally, across many parts of the business cycle. With economic uncertainty remaining elevated, and an equity rally that is faltering, investors could consider quality as their portfolio anchor.
1 WisdomTree, Bloomberg. As of 27 September 2023.
2 WisdomTree, Bloomberg, Morningstar, June 2016 to June 2023.
Related blogs
About the contributor

Head of Research, WisdomTree Europe.
Pierre Debru leads WisdomTree’s European research team and plays a pivotal role in the strategic direction of our European research efforts. His key areas of expertise extend across equity factors and quantitative strategies, portfolio construction and model portfolios, and thematic and crypto investments. Before joining the company in 2019, Pierre worked in Investment Research for DWS and the Xtrackers range for over five years. During this period, he focused on smart beta investments, model portfolio construction and thought leadership. Pierre has over 20 years of experience in investments and structured asset management. He graduated from Ecole Central Paris and obtained a Master of Science in Mathematics applied to Finance.