

How factor analysis shows that quality and growth outperforms
Published 25 January 2018
Have you allocated to quality and growth in your 2018 equity allocation?
Accelerating global growth, tightening credit conditions and high valuations will compel investors to discriminate between equity ETFs, opting for targeted style strategies in 2018. Quality and growth may be the styles of choice, and WisdomTree’s Quality Dividend Growth ETF offers investors exposure to both factors. This blog looks at these factors in more detail, and how they have contributed to our strategy’s long-term performance.
Screening for quality and growth
Quality Dividend Growth was our top performing dividend strategy in 2017. All three regional exposures (Eurozone [ETF ticker: EGRA], US [DGRA] and Global [GGRA]) comfortably outpaced their market-cap peers by over 5%. Underpinning this return profile is a robust screening methodology that selects future dividend growers that offer what we believe to be the best quality and growth characteristics. This includes long-term earnings growth expectations (50% weight), three-year average return-on-equity (25% weight) and three-year average return-on-assets (25% weight). The resulting basket is then weighted by cash dividends for greater stability.
More quality and growth versus market-cap
By regressing the since-inception monthly returns of our three Quality Dividend Growth exposures against Fama-French's five equity factors (Market Risk, Size, Value, Quality and Growth), we can explore whether our methodology’s quality and growth screens translate into higher factor loadings.
Figure 1 showcases our regression results, with higher quality and growth coefficients evident across our three exposures. Take our Eurozone Quality Dividend Growth fund, for example. It’s quality and growth coefficients of 0.27 and 0.24, respectively, are both markedly higher than those of MSCI EMU (quality, 0.02, and growth, 0.07). This suggests our stock basket captured more profitable companies (higher quality loading) that grew total assets conservatively (higher growth loading) relative to market-cap peers.
Figure 1: Quality Dividend Growth captures more growth and quality versus market
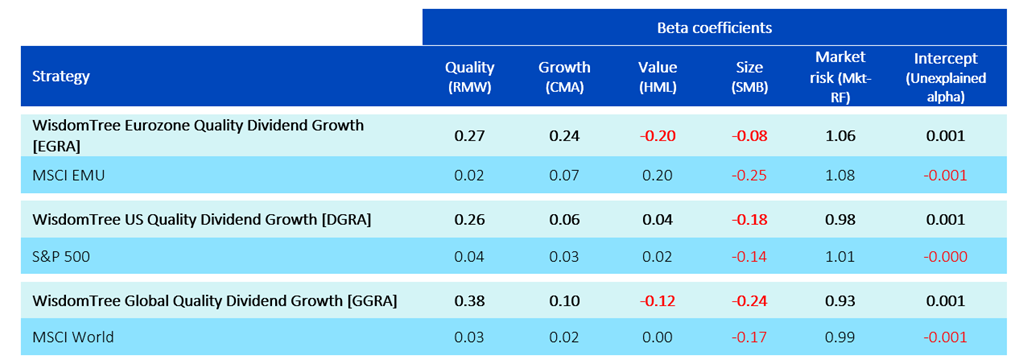
Source: WisdomTree and Fama French Data Library. Data as of 31/10/17. Regression start dates: EGRA from 31/07/2006, DGRA from 31/12/2003, GGRA from 31/12/2002.
Click to enlarge
Given our profitability screens, a higher quality loading versus market-cap peers can be expected. However, the selection of dividend payers also plays a role in enhancing our quality exposure, simply because of their tendency to generate more sustainable cash flows versus non-dividend payers.
At the same time, our higher growth loadings are also intuitive given how dividend-payers are more likely to enhance shareholder value by reinvesting earnings into dividend growth. This ensures earnings are not squandered through overinvesting, instead striking a balance between distribution and reinvestment that is more sustainable over time.
Discriminating dividend-payers for the highest return-on-assets also enforces a more conservative growth profile by limiting the extent to which companies can cheaply lever up balance sheets. Against a backdrop of the Fed raising rates further and the ECB unwinding QE in 2018, containing borrowing costs and default risk is not only prudent but necessary to justify staying invested in an increasingly expensive equity market. In this regard, quality dividend growth appears better positioned for a rising rates environment relative to market-cap exposures.
Given these stronger stock fundamentals, our Eurozone and Global exposures justifiably command a lower value loading versus peers. However, it is also possible for value to accompany quality and growth, as our US Quality Dividend Growth strategy’s lower value loading aptly demonstrates this with lower P/E ratios. The rebalance towards dividends (as opposed to market cap) in December has also worked to further suppress valuations. Nonetheless, with a maturing equity market rally at this point in the cycle increasingly reliant on hard fundamentals as artificial support levers from monetary stimulus dissipate, the higher profitability and lower financial leverage of quality dividend growers should offer better value overall vs. plain-beta exposures.
Quality and growth tilts generate alpha
In fact, a look at our historic performance profile underscores why it can be worth paying for quality fundamentals. Consider Figure 2, whereby we depict the factor return decomposition for our three exposures against market-cap peers.
Figure 2: Quality fundamentals outperform
Estimated return factor decomposition (annualised)
Source: WisdomTree and Fama French Data Library. Data as of 31/10/17. Regression start dates: EGRA from 31/07/2006, DGRA from 31/12/2003, GGRA from 31/12/2002.
Past and backtested data not indicative of future performance.
Whilst our Quality Dividend Growth strategies outperformed annually by between 1.4% and 4.1% (expressed as the difference between the sum of the five-factor return contributions), our quality and growth loadings were the standout contributors to alpha. Both factors outperformed the broader equity market and accounted for over 50% of the excess return for our strategies. Hence, whilst quality and growth typically come at a market premium, long-term performance results suggest this premium is largely justified.
Conclusion
WisdomTree’s Quality Dividend Growth strategy captures both quality and growth factors, presenting a targeted style solution that is well-positioned for rising rates. This is complemented by favorable sector exposures, with high weights in low-leveraged sectors such as IT, and underweights in financials that helps avoid the squeeze in bank profitability arising from flattening yield curves in the US. Combining all these advantages, our basket of quality dividend growers may offer a more attractive investment strategy than market-cap peers.
Investors sharing this sentiment may consider the following UCITS ETFs
WisdomTree’s Quality Dividend Growth strategies offer exposures to various geographies including Eurozone, Global developed and US equities as shown in the table below:
Fund name | Ticker | ISIN | Listing Currency | Share Class Currency | TER |
|---|---|---|---|---|---|
WisdomTree Eurozone Quality Dividend Growth UCITS ETF - USD Acc | IE00BZ56TQ67 | EUR/GBx | EUR | 0.29% | |
WisdomTree Eurozone Quality Dividend Growth UCITS ETF - USD | IE00BZ56SY76 | EUR/GBx | EUR | 0.29% | |
WisdomTree US Quality Dividend Growth UCITS ETF - USD Acc | IE00BZ56RG20 | USD/GBx | USD | 0.33% | |
WisdomTree US Quality Dividend Growth UCITS ETF - USD | IE00BZ56RD98 | USD/GBx | USD | 0.33% | |
WisdomTree Global Quality Dividend Growth UCITS ETF - USD Acc | IE00BZ56SW52 | USD/GBx | USD | 0.38% | |
WisdomTree Global Quality Dividend Growth UCITS ETF - USD | IE00BZ56RN96 | USD/GBx | USD | 0.38% |
Listing Currency
Share Class Currency
WisdomTree Eurozone Quality Dividend Growth UCITS ETF - USD Acc
IE00BZ56TQ67
WisdomTree Eurozone Quality Dividend Growth UCITS ETF - USD
IE00BZ56SY76
WisdomTree US Quality Dividend Growth UCITS ETF - USD Acc
IE00BZ56RG20
WisdomTree US Quality Dividend Growth UCITS ETF - USD
IE00BZ56RD98
WisdomTree Global Quality Dividend Growth UCITS ETF - USD Acc
IE00BZ56SW52
WisdomTree Global Quality Dividend Growth UCITS ETF - USD
IE00BZ56RN96
+ Why European investors are allocating to growth strategies
+ US tax cuts: small cap and dividend growth strategies to benefit