
Going Viral
Published 17 February 2020

Head of Investment and Fixed Income Strategy
This year has gotten off to an unusual start in the financial markets. Typically, the focus would be on the Federal Reserve (Fed) and/or economic developments, but unfortunately the coronavirus has taken centre stage. I thought it would be useful to offer some insights from a bond market perspective, using the SARS (Severe Acute Respiratory Syndrome) outbreak of November 2002 to July 2003 as a comparative event.
I’m certainly not the only one doing such an analysis, but what I found is that the SARS episode did not occur in a vacuum. The current coronavirus and attendant risk-off[1]trade is, without a doubt, the key driver of recent developments in the fixed income arena, especially for Treasuries (UST). However, after digging deeper (and being active in the markets at the time), the SARS episode was not necessarily the primary force driving rate trends 17 years ago. At that time, investors were still coping with the aftermath of the 9/11 attacks and anthrax scares of late 2001, as well as the corporate governance scandal (remember Enron and WorldCom). From a macro perspective, the US was just coming out of the 2001 recession and the Fed was in the middle of an aggressive rate cutting cycle, taking Fed Funds from 6.50% ultimately down to 1.00% by June 2003.
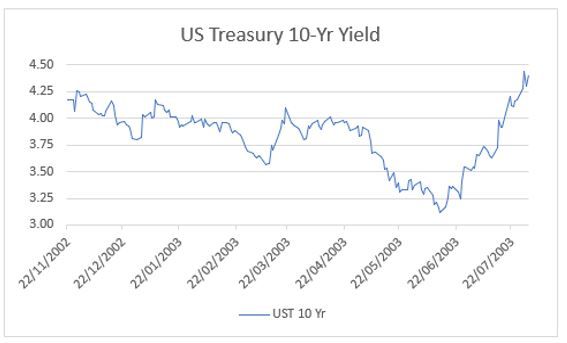
Here are some key highlights and graphs from the November 2002 through July 2003 period:
-The UST 10-year yield fell at one point by roughly 105 basis points (bps), but ended up being almost 25 bps higher than the yield level that was posted before the SARS news “hit the tape”
-The 3-month/10-year yield curve flattened at one point by roughly 75 bps, but finished 50 bps wider than the November 2002 reading
-The UST 2-year/10-year spread only narrowed by a little less than 15 bps, but was 55 bps wider come the end of July 2003
-US real GDP fell to a low of +0.6% in Q4 2002 but snapped back to +7.0% in Q3 2003
-US investment grade and high yield spreads were on a descending trajectory throughout, narrowing by 84 bps and 365 bps, respectively
Source: Bloomberg, as of 1/30/2020.
You cannot invest directly in a index. Historical performance is not an indication of future performance and any investments may go down in value.
Source: Bloomberg, as of 1/30/2020.
You cannot invest directly in a index. Historical performance is not an indication of future performance and any investments may go down in value.
Here are some key highlights for the current period:
-The UST 10-year yield has fallen about 30 bps since the coronavirus headlines began
-The UST 3-month/10-year curve has narrowed by a similar 30 bps, reflecting the aforementioned drop in the 10-year yield, and is now inverted again at -2 bps
-The UST 2-year/10-year curve has flattened 6 bps to +19 bps
-Investment Grade (IG) spreads have increased a modest 5 bps while High Yield (HY) spreads have widened more than 65 bps
To be sure, China’s economy is far more of a global influence in 2020 than it was 17 years ago. There is no doubt this outbreak will negatively impact Chinese GDP and, by extension, global growth. Estimates seem to be centred around a drag of around 0.5–1.0 percentage points for China, and 0.2–0.3 percentage points for the global outlook, assuming a peak is reached in Q1. While the US is not insulated, the impact on real GDP is only expected to be a couple of percentage points at this time. Indeed, US total trade with China as a per cent of GDP is in the low single digits.
Once the coronavirus does peak, we would anticipate history repeating itself in the UST market with the 10-year yield moving back closer to 2% and the aforementioned yield curves re-steepening, and in the case of the 3-mo/10-yr curve, going back into positive territory. HY spreads could also experience some narrowing from the levels as of this writing.
Any economic drags now will more than likely be reversed, and then some, in subsequent quarters. In terms of the Fed, the January Federal Open Market Committee meeting underscored policy being in a holding pattern, despite Fed Funds Futures pricing in two rate cuts this year.
Unless otherwise stated, data source is Bloomberg, as of 1/30/2020.
[1] risk-off: Sentiment of uncertainty concerning overall market conditions.
Related blogs
+ What is the highest yielding treasury security?
Related products
+ WisdomTree USD Floating Rate Treasury Bond UCITS ETF - USD
About the contributor

Head of Investment and Fixed Income Strategy
Kevin serves as the Head of Investment and Fixed Income Strategy. In this role, he writes macro and fixed income-related content and works closely with the sales, research and marketing teams. In addition, Kevin conducts client-facing webinars and meetings, providing expertise on WisdomTree’s existing and future bond ETFs. Prior to joining WisdomTree, Kevin spent 30 years at Morgan Stanley, where he was Managing Director and Chief Fixed Income Strategist for Wealth Management. He was responsible for tactical and strategic recommendations and created asset allocation models for fixed income securities. He was a contributor to the Morgan Stanley Wealth Management Global Investment Committee, primary author of Morgan Stanley Wealth Management’s monthly and weekly fixed income publications, and collaborated with the firm’s Research and Consulting Group Divisions to build ETF and fund manager asset allocation models. Kevin has an MBA from Pace University’s Lubin Graduate School of Business, and a B.S. in Finance from Fairfield University.