BTCW LN
WisdomTree Physical Bitcoin

Published 22 May 2025

Director, Digital Assets Research
In financial markets, liquidity is often treated as a secondary variable – a derivative of price action, investor sentiment, or macro conditions. In crypto, it is the opposite. Liquidity is not the echo; it is the signal.
As the asset class matures and institutional adoption deepens, liquidity is becoming a barometer for market health, risk appetite, and even macroeconomic turning points. It is no longer just about who is trading—it is about why capital is moving, where risk is being priced, and how the next market cycle might unfold.
Traditional markets benefit from deep order books, regulated venues, and a mature set of standardised liquidity metrics. Crypto operates on a different landscape: thinner books, fragmented liquidity pools, and a relentless 24/7 volatility. But this comes with an edge.
Crypto liquidity dynamics are often sharper, more transparent, and arguably more predictive than those in traditional markets. They react faster, offering early signals of capital inflows and outflows.
Two key metrics anchor this liquidity landscape:
Liquidity ranking | Cryptocurrency | 0.1% depth points | 1% depth points | Exchange points | Spread points | Volume points |
|---|---|---|---|---|---|---|
1 | Bitcoin | 50 | 50 | 47 | 49 | 50 |
2 | Ether | 49 | 49 | 50 | 47 | 49 |
3 | XRP | 48 | 48 | 49 | 43 | 48 |
4 | Solana | 47 | 47 | 45 | 44 | 47 |
Source: Kaiko Research Q1 2025. Excluding wrapped tokens and derivatives. Centralised exchanges only. Historical performance is not an indication of future performance and any investment may go down in value.
Bitcoin leads the liquidity rankings and scores the highest across depth and volume metrics:
Where could bitcoin improve:
When order books thicken and spreads tighten, that is often the first sign that capital is returning. Conversely, when liquidity dries up, it is the canary in the coal mine—a warning that risk appetite is fading fast.
Crypto liquidity is reflexive. Improved liquidity compresses volatility, attracts institutional allocators, and drives volume—a flywheel that powers rallies. But the same dynamic works in reverse, exacerbating drawdowns and panic.
Consider late 2022. Post-FTX, bitcoin liquidity collapsed—spot depth on major exchanges fell over 50%, hitting levels not seen since 2018. This was not merely a symptom of price declines. It was a leading indicator of capital flight and counterparty distrust.
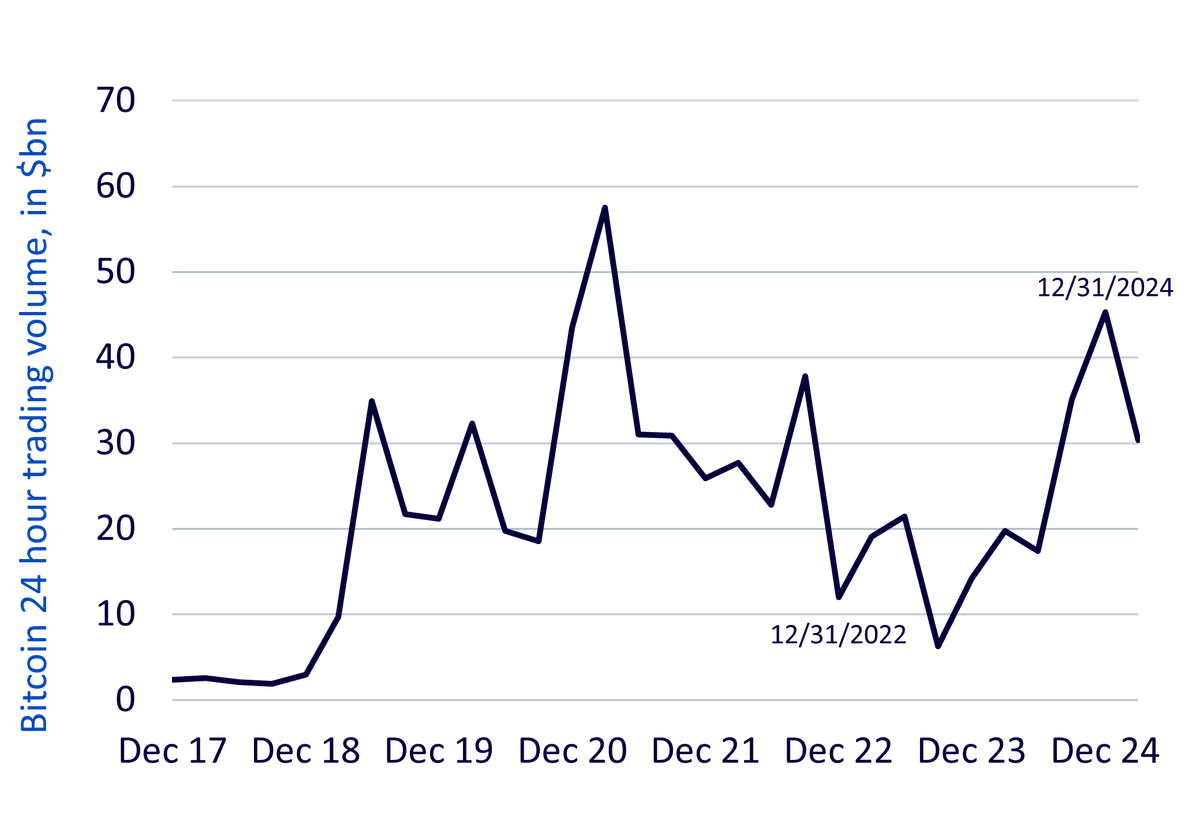
Source: Artemis Terminal, WisdomTree. 13 May 2025. Historical performance is not an indication of future performance and any investment may go down in value.
Fast forward to 2024. The US launch of spot bitcoin exchange-traded products (ETPs) changed the game. Inflows drove not only volumes but also deeper books, tighter spreads, and structurally improved market quality. This was not just institutions kicking the tires, this was meaningful capital deployment, visible in real-time through the liquidity lens.
ETPs are now critical to the crypto liquidity equation. They are not just products, they are infrastructure. Every inflow into a crypto ETP translates directly into underlying market flows: deepening books, reducing spreads, and lowering friction for everyone else.
This is where liquidity reveals its full analytical power. It provides granular, real-time insight into capital positioning and behavioural shifts that traditional markets struggle to capture.
It tells us:
Scenario | Interpretation |
|---|---|
ETH/BTC spreads widen vs BTC | Risk-off: capital rotating into crypto mega cap, bitcoin |
ETH/BTC spreads tighten vs BTC | Risk-on: Ether gaining liquidity lead, often precedes altcoin rallies |
Source: WisdomTree. 13 May 2025. BTC = bitcoin. ETH = Ether.
This brings the barometer analogy full circle:
Liquidity in crypto is not a background condition, it is a leading signal. A behavioural thermometer. A real-time forecast of investor intent.
In crypto, liquidity does not just follow demand, it defines it. For allocators and active managers, liquidity metrics should be front and centre when assessing market conditions and strategy.
Because in this market, liquidity is not just the barometer. It is the weather forecast. And sometimes, it is the storm warning.

Director, Digital Assets Research
Dovile Silenskyte is a director of digital assets research at WisdomTree. Before joining WisdomTree in May 2024, Dovile worked as an index equity product strategist at BlackRock. Currently, she is responsible for conducting analyses for in-house digital assets publications and assisting the sales team with client queries about products and markets. Dovile holds an MSc in Finance from Texas A&M University – Commerce, and she is also a chartered financial analyst (CFA).


