
60/40: Reports of My Death Are Greatly Exaggerated


It’s infinitely easier to write a critical article than it is to change an industry benchmark. That being said, I think there is a straightforward way to improve an allocator’s potential outcomes going forward. But first, a bit of context.
60% S&P 500 Index/40% Bloomberg U.S. Aggregate Index (Agg) Calendar Year Returns, 1976–July 8, 2022
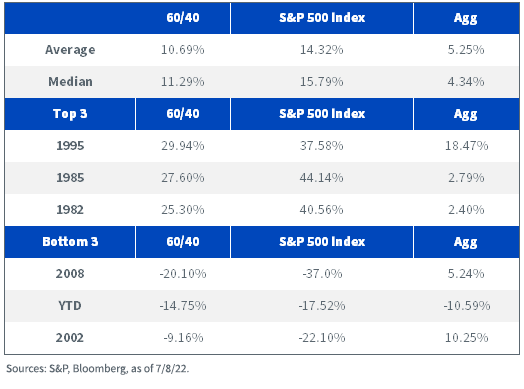
Negative Calendar Year Returns for 60/40: 9 out of 46 (1977, 1981, 1994, 2000, 2001, 2002, 2008, 2018, 2022)
In basically one out of five years, 60/40 has delivered negative calendar year returns. This is also the same frequency that stocks have delivered a negative calendar year return, but they don’t always overlap. I suspect the reason we’ve seen so many articles bemoaning the shortcomings of 60/40 is that 2022 has seen some of the worst absolute returns for 60/40 since the inception of the Agg. In fact, only 2008 delivered a worse performance. However, as we show in the table below, negative returns for 60/40 tend to be manageable, particularly when fixed income returns are positive.
60% S&P 500 Index/40% Agg Negative Calendar Year Returns, 1976–July 8, 2022
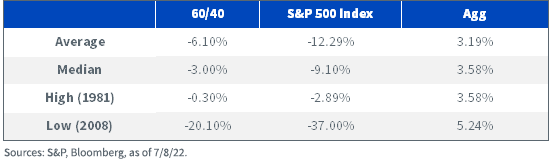
Negative Calendar Year Returns for 60/40 with fixed income down, equities up: 1 out of 46 (1994)
Another reason is that, unlike 2022, fixed income returns are generally not the primary driver of 60/40 performance. In fact, there has only been one instance when bonds pulled down the total returns of 60/40 while equities were positive. Put another way, equities still dominate the total returns owing to the magnitude of their returns as well as their slightly higher weight in 60/40 portfolios. This is also something weighing on investor sentiment after U.S. equities’ 12-year run higher.
Negative Calendar Year Returns for 60/40 with fixed income down, equities down: 1 out of 46 (2022)
So why is 2022 such an anomaly? Well, this is the first year when both stocks and bonds have been down in tandem (and unfortunately both are down around 10%). This gets back to the fundamental reason why people have allocated to 60/40 historically: low correlation between equities and fixed income. With interest rates low, the possibility of negative total returns increases. Should equities fall at the same time, correlations go positive when both markets are selling off.
Years with back-to-back negative fixed income returns: 1 (2021–2022)
While U.S. rates have backed off of the highs of May, we do have precedent for back-to-back calendar year losses. However, with rates at significantly higher levels than they started the year, it seems very unlikely that fixed income will be able to generate significant returns through the end of the year. But with the market actually starting to price in rate CUTS in 2023, it seems reasonable to expect that fixed income returns will be much less of a headwind in 2023 than they have been in 2022.
Years with back-to-back negative 60/40 returns: 2 (2000–2001, 2001–2002)
It’s worth noting that the best returns in the history of 60/40 occurred in 1995, the year after fixed income returns pulled a modestly positive equity market down into negative territory. However, there’s also precedent for back-to-back negative total returns for 60/40. As the tech bubble was bursting, 60/40 faced its longest period of headwinds in its history.
Overcoming High Correlation to Equity Markets
Based on everything I’ve seen, I think that 60/40 benchmarks could still make sense for a large majority of advisors. However, it is true that equities still dominate the expected total returns of the benchmark. Therefore, if advisors are uncomfortable with this, they could consider increasing allocations to less correlated assets like alternatives. The challenge is that in order to do that, it is typically necessary to reduce exposure to stocks or bonds.
A Possible Solution
While many advisors dismiss leverage out of hand, I would argue that modest amounts of leverage can actually reduce risk in a portfolio if you think long term. The WisdomTree Efficient Core Fund (NTSX) combines U.S. equity exposure and cash with an overlay of U.S. Treasury futures. The resulting portfolio can provide similar exposure to a leveraged 60/40 portfolio. By deploying a modest amount of leverage, an investor may want to consider making a smaller allocation to 60/40 in order to track their benchmark. This frees up capital to invest in alternatives.
In short, this allows you to maintain benchmark exposure, but complement those exposures with assets that are less dependent on U.S. interest rates falling or equity markets rising. However, this is not a panacea. Leverage works in both directions, and unfortunately, a leveraged 60/40 can significantly increase downside risk. But when used effectively in combination with trend-following strategies like managed futures or inflation hedges like long-only commodities, we believe it’s possible for investors to not only decrease their correlation to equities, but increase total returns as well.
Important Risks Related to this Article
There are risks associated with investing, including the possible loss of principal. While the Fund is actively managed, the Fund’s investment process is expected to be heavily dependent on quantitative models and the models may not perform as intended. Equity securities, such as common stocks, are subject to market, economic and business risks that may cause their prices to fluctuate. The Fund invests in derivatives to gain exposure to U.S. Treasuries. The return on a derivative instrument may not correlate with the return of its underlying reference asset. The Fund’s use of derivatives will give rise to leverage and derivatives can be volatile and may be less liquid than other securities. As a result, the value of an investment in the Fund may change quickly and without warning and you may lose money. Interest rate risk is the risk that fixed income securities, and financial instruments related to fixed income securities, will decline in value because of an increase in interest rates and changes to other factors, such as perception of an issuer’s creditworthiness. Please read the Fund’s prospectus for specific details regarding the Fund’s risk profile.Share & Comment
Popular Posts
Categories
Related Links