
Quality for Uncertain Times


In the last few months, market visibility has significantly declined. The war in Ukraine created major geopolitical uncertainty. Inflation and the central banks’ hawkish stands weigh on developed economies and growth expectations. Quite logically, volatility is back in the markets. While the 20-day historical volatility of the MSCI World Index hovered around 10% for most of 2021, it has now increased sharply, with current levels between 20% and 25%. After sharply correcting in January and February, markets now appear to be moving sideways.
In such uncertain times, many investors are contemplating reducing risk in their portfolios. Still, a reallocation from equity to fixed income logically loses some of its appeal when interest rates may be on the verge of snapping a 40-year downtrend. Shifting equity exposures toward more robust higher-quality equity names could help protect the downside while maintaining exposure to the upside.
Quality for Lower Visibility and Increasing Volatility in the Markets
Profitability as a proxy for quality captures the outperformance of highly profitable firms that can continue to thrive in difficult economic and market conditions thanks to strong, proven business models. Such companies tend to be in demand when investors start to worry about future outcomes and when economic visibility is reduced, leading to outperformance in high-volatility and end-of-cycle periods.
In figure 1, we compare the behavior of highly profitable companies and less-profitable companies in different volatility regimes. To do so, we calculate the 20-day rolling historical volatility of U.S. equities since 1963 and split the periods into five groups (quintiles) based on the level of volatility. Quintile #1 regroups the one-fifth of the periods with the lowest observed volatility (all periods with volatility below 8.1% annualized). Quintile #5 regroups the one-fifth of the periods with the highest observed volatility (all periods with volatility above 17.5% annualized).
Figure 1: Behavior of Highly Profitable Companies and Less-Profitable Companies in Different Volatility Regimes
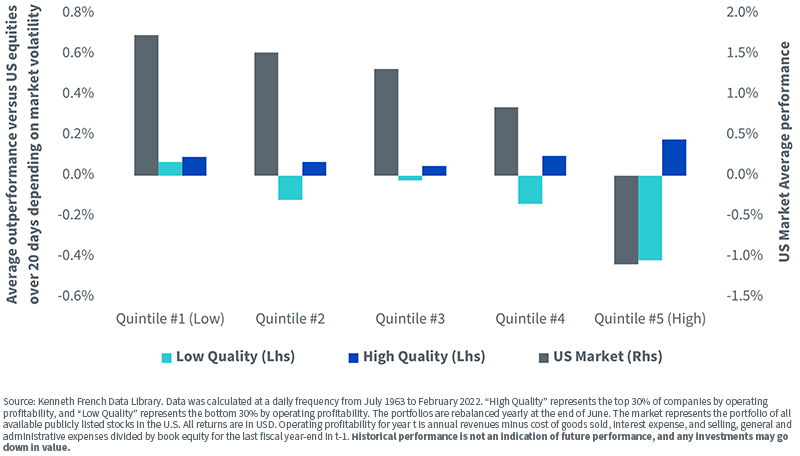
We observe that less-profitable, low-quality companies tend to outperform in periods of low volatility (in quintile #1), but their average underperformance increases with volatility.
On the contrary, highly profitable, high-quality companies see their outperformance increase with volatility. In other words, highly profitable companies tend to act as a safe haven for investors in periods of stress and high volatility, leading to the highest outperformance in those periods.
It is worth noting as well that those high-quality companies historically outperform in all five volatility regimes. This is why quality is considered the “all-weather factor”:
- It can help investors build wealth over the long term
- It can weather the inevitable storms along the way
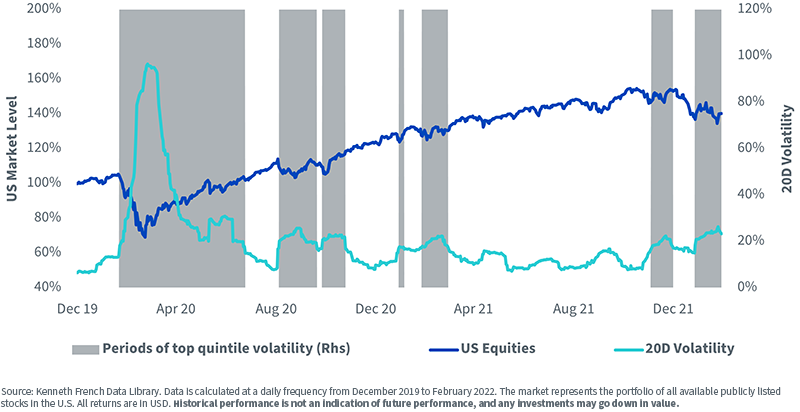
It is worth noting, after a long period of relatively low volatility between March 2021 and November 2021, that the U.S. markets have gone through two periods of high volatility recently: one in December 2021 and one ongoing since January 2022.
Figure 2: U.S. Equity Market and Volatility Levels Since 2019
Since quality companies generate high revenues, they can grow and compound wealth in the future.
Thanks to their solid business models and financial strength, they can withstand unexpected events such as economic downturns or geopolitical shocks.
Quality for Inflationary Times
In inflationary times, companies’ bottom lines live or die by their pricing power, i.e., their capacity to increase prices in line with their costs. Very often, pricing power and high-quality business go hand in hand. In the word of Chairman and CEO Warren Buffett, “If you’ve got the power to raise prices without losing business to a competitor, you’ve got a very good business, and if you need a prayer session before raising the price by a tenth of a cent, you’ve got a terrible business.”1
Highly profitable companies with a high return on equities and a high return on assets tend to display such high pricing power. Using such fundamental screens tends to unearth:
- Luxury companies
- Companies with strong brand names
Looking at the WisdomTree U.S. Quality Dividend Growth Index, we find Apple, Microsoft, Coca Cola and Pepsico in the top 15. Coca-Cola and PepsiCo raised prices within days of each other last July and have recorded substantial margins since then.
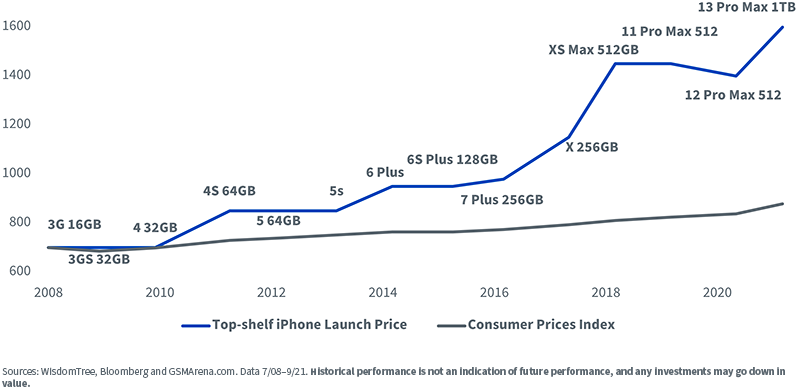
Or, taking the example of Apple, its products are very often recognized as “the best” in the industry. It gives the company the right to charge a premium over its competitors. Apple’s pricing power is obvious, looking at the price of the top-shelf iPhone since 2008 in figure 3. When the Consumer Price Index (CPI) grew by 25.6% over the period, the price of the iPhone went up by 128%. Yet Apple’s sales numbers remained very high.
Figure 3: Evolution of the Price of iPhones vs. Inflation
Quality in the Value vs. Growth Debate
With the beginning of the rate hiking cycle in the UK and the U.S., investors started to worry about the implied duration in their equity portfolio. This led to a sharp outperformance of value stocks versus growth stocks over the last three to four months. The quality factor ended up caught in the crosshairs.
Using fundamental filters to find quality stocks with no other considerations will very often lead to a growth bias that can be very detrimental to the strategy in the current market environment. The MSCI USA Sector Neutral Quality Index is a clear example of this bias at the moment. Its methodology does not control for its value or growth exposure, leading to growth being the third biggest factor exposure in the portfolio after profitability and momentum2. Year to date, this led to an underperformance of -3.3% versus the S&P 5003.
However, it is possible to find high-quality stocks in all parts of the market, in all sectors and in all factors. It is possible to find high-quality stocks that are cheaper than the market. Building a high-quality strategy with a value tilt is possible, for example, if the investment process is built with valuations in consideration. Quality-oriented strategies that factor in value metrics in their processes have tended to do better this year. The WisdomTree U.S. Quality Dividend Growth Index, for example, outperformed the S&P 500 by 1.2%3 over the same period, a 4.5% differential from the MSCI Index. This is the result of our focus on high-quality, dividend-paying companies, which allows us to deliver a high-quality exposure laced with a value tilt.
1 Andrew Frye and Daking Campbell, “Buffett Says Pricing Power More Important Than Good Management,” Bloomberg, 2/18/11.
2 Sources: WisdomTree, Bloomberg, as of 3/28/22. Analysis is run on holdings using PORT in Bloomberg.
Factor definitions and calculations are explained in “US Equity Fundamental Factor Model,” which is available in PORT Help in Bloomberg. Historical performance is not an indication of future performance, and any investments may go down in value.
3 Sources: WisdomTree, Bloomberg, 12/31/21–3/28/22. You cannot invest in an index. Historical performance is not an indication of future performance, and any investments may go down in value.
Important Risks Related to this Article
Pierre Debru is an employee of WisdomTree UK Limited, a European subsidiary of WisdomTree Asset Management Inc.’s parent company, WisdomTree Investments, Inc.Share & Comment
Popular Posts
Categories
Related Links