
The Crisis-Stricken Stock Market is Favoring Dividend Screens


Speculative stocks have had an ugly five months. The S&P 500 Pure Growth Index, which tracks the “growthiest” of growth stocks, has ceded a huge chunk of its prior outperformance relative to dividend-paying value stocks (figure 1).
It all started in November, around the time the Street started coming to terms with “transitory” inflation being not-so-transitory.
And it’s been wild.
The ratio between the S&P 500 Pure Growth Index and the S&P 500 High Dividend Index has not only come crashing down—meaning growth stocks are underperforming—but it just took out support from a critical transition day: March 6, 2009. That was when the 2007–2009 bear market turned into the 2009–2021 bull market.
Figure 1: S&P 500 Pure Growth Index Divided by S&P 500 High Dividend Index
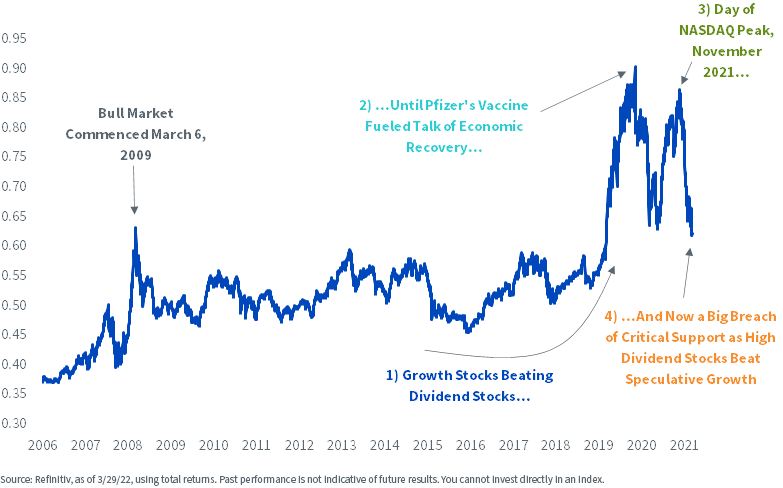
When the banking system failed in 2008, growth beat value. As society recovered, everything switched; value started beating growth.
The two sides of the coin looked like this:
2008 Fear: Growth Beat Value
2009 Recovery: Value Beat Growth
Today, it’s the opposite.
When fear strikes, value has held up better than growth. When the bulls get the upper hand, growth has seen relief.
Covid Reopening Has Morphed into “Stay Home Because of Gas Prices”
Three hundred dollars per barrel, “if not more.” That was the warning from Russia’s Deputy Prime Minister Alexander Novak on state TV on March 7, as the West tried to figure out how to freeze out Russian oil. He is of course going to say that, so I don’t want to spend the time wondering about $300 oil just yet.
Instead, I point it out because maybe $300 is the new “shock number.” The big, bold call used to be $100. When I was very young and starting to pay attention to these things in the 1990s, I specifically remember it being wildly bullish if you called for the high, high, high price of $30 per barrel.
Ask yourself: if the Energy team at Goldman were to put out a $200/barrel forecast right now, would you laugh them out of the room? I’d read that report. It’s not so outlandish; Rystad Energy, the huge consultancy, says we could get there.
Let’s say it doesn’t get that bad. Instead, Brent crude goes sideways, chopping around its current $109 level. That is still high enough to make stagflation dominate the conversation.
One of the reasons our value mandates have held strong is due to the natural grab for Energy stocks when you run a dividend screen. One of our flagships, the WisdomTree U.S. LargeCap Dividend Fund (DLN), has 8% in the sector. In contrast, the Russell 1000 only has 2.5% in the group, leaving it with very few winners during the oil-induced stock market panics of recent months.
The market has followed the public’s frustration with inflation. In recent weeks, Moroccan truckers have planned a three-day strike over fuel prices. Italian heavy goods truckers are also planning protests, while there is talk of the same in Ireland too. The public has come into the streets in both Pakistan and Yemen, both because of inflation.
If you had to use a word or two to describe the stock market in 2020, it would be “Covid.” For 2021, perhaps “recovery.” For 2022, maybe it will be “inflation protests.”
Inside the S&P 500, the action has been problematic for industry groups most associated with Covid reopening, now that the middle class is giving second thought to driving the kids to Disney World with gasoline at $5 in many states.
Casinos, restaurants and hotels have all slid harder than the broad market lately, and unnervingly so. Airlines were finally seeing light at the end of the Covid tunnel, but surging jet fuel prices have the market concerned for that industry too.
Figure 2: Covid Reopening Industries Relative to S&P 500
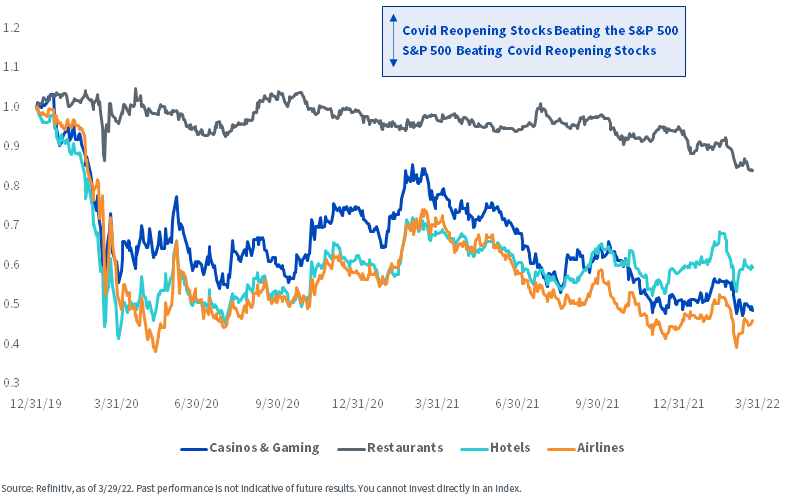
Look at the tumble in the stock prices of the companies whose offerings consumers choose to purchase—a hotel room, a restaurant meal—and it’s plain to see that the stock market is sending a message: it is time to respect recession risk. I’m not quite there yet, but it’s on the radar. Let me explain why I’m not completely freaking on American consumer health.
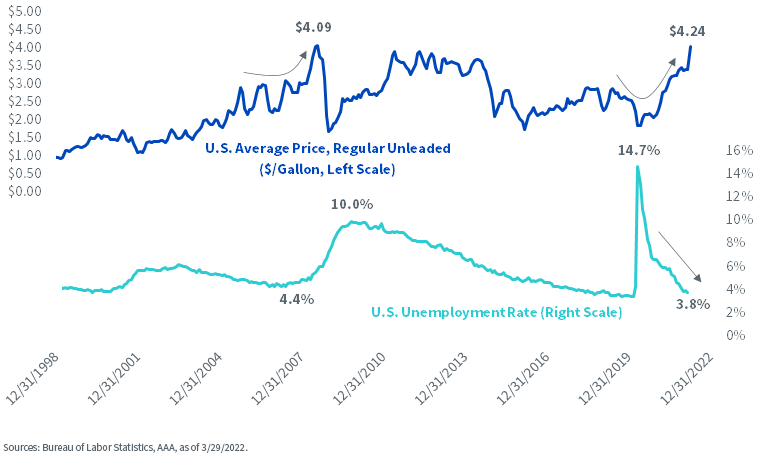
Unlike the crescendo of the 2008 oil crisis, labor market conditions today are improving, not collapsing. Look at the “Help Wanted” signs in your own neighborhood. It’s a far cry from the image etched into my own brain the last time gasoline was in crisis: Lehman employees carrying cardboard boxes out of the building.
Figure 3: U.S. Average Gasoline Price vs. Unemployment
And the cars we drove when gasoline spiked in 2008 had lower fuel economy. Whereas the Toyota Camrys of that era got 25 miles per gallon, every Camry manufactured since 2018 has gotten at least 32 miles per gallon, with hybrids getting much more.
Even a big guzzler like the Ford F-150, “America’s Best Selling Pickup Truck,” gets about 25 miles per gallon in late models.
Figure 4: Ford F-150 Fuel Economy by Model Year (Miles per Gallon)
.png)
Additionally, a dollar meant something different in the context of the 2008 median household income of $50,000. Today’s median is $67,000. Gas is pinching consumers, but I suspect we need something like sustained $6 per gallon for it to feel like $4 a generation ago. As I write, AAA calculates that the high price states -- Illinois, Hawaii, Alaska, Arizona, Utah, Nevada, California, Oregon and Washington -- each have gasoline in its highest range, $4.43 to $5.92 per gallon. Troublingly, only 11 states remain under $4.
If gas stops here, I think we can get through 2022 without a recession. Even so, it’s undeniable: the market’s psychology has morphed from a stock market that was ruminating on a second coming of “The Roaring 20s” to one that has become disgusted with something like a 1970s-style malaise.
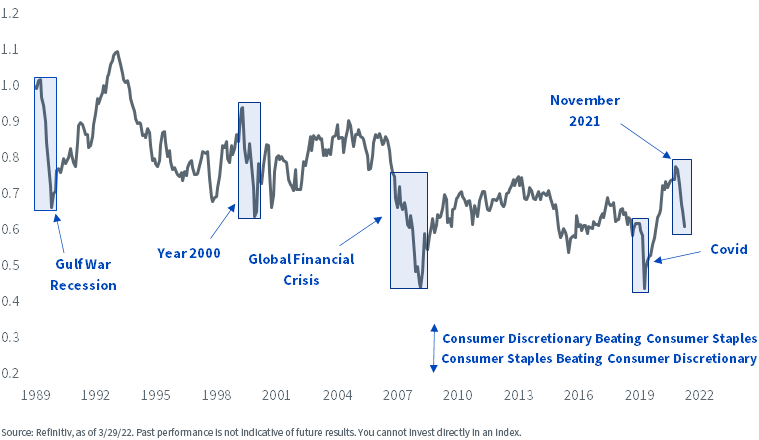
Figure 5 shows the performance of an equal-weighted basket of Consumer Discretionary stocks relative to Consumer Staples. I went with equal-weighting because Amazon and Tesla comprise 40% of the cap-weighted basket and I don’t want those two stocks to skew the chart.
The theory goes that when Consumer Discretionary stocks outperform Consumer Staples, there is confidence in the system; people are choosing to buy $5 coffees and $150 sneakers, neither of which is an item that anyone needs.
In other times, when the Consumer Staples sector is beating Consumer Discretionary, something is broken. People keep buying bread and paper towels, but not a new dishwasher.
The word “disturbing” comes to mind when I review figure 5.
Figure 5: S&P 500 Equal-weight Consumer Discretionary Relative to Equal-weight Consumer Staples
The trouble in Discretionary stocks is a giant headache for the Russell 1000 Growth index, which is heavy in the sector. In contrast, being so light in it is part of the reason our dividend stuff has been able to outperform in recent months. One of our big strategies is DLN, which has just 5.6% in Consumer Discretionary (figure 6).
Figure 6: Consumer Staples & Discretionary Weights
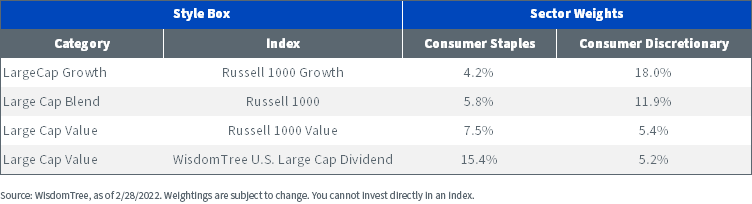
For definitions of terms in the chart above, please visit the glossary.
I have two recent blogs posts that touch on similar concepts.
For DLN’s “cousin,” the WisdomTree U.S. Value Fund (WTV), I think the half-century chart on buybacks in the middle of this post is pretty compelling.
If my societal malaise concepts resonate, there’s this post, which touches on DLN.
Important Risks Related to this Article
There are risks associated with investing, including the possible loss of principal. Funds focusing their investments on certain sectors increase their vulnerability to any single economic or regulatory development. This may result in greater share price volatility. Dividends are not guaranteed, and a company currently paying dividends may cease paying dividends at any time. Please read the Fund’s prospectus for specific details regarding the Fund’s risk profile.Share & Comment
Popular Posts
Categories
Related Links