
We Aren't Done with Inflation


I think the September Consumer Price Inflation (CPI) report measured prices on Neptune, not Earth.
You do not have to live in a piping hot housing market like the ones in Scottsdale, Austin or Miami to know that the shelter subcomponent of CPI seems way off: a 3.2% year-over-year increase is just not in the ballpark.
You know it, I know it, everyone knows it: houses, apartments, condos—their prices all zoomed over the last year, everywhere. But according to the Bureau of Labor Statistics (BLS), apparently not (figure 1).
Figure 1: A Snip from the September CPI Report
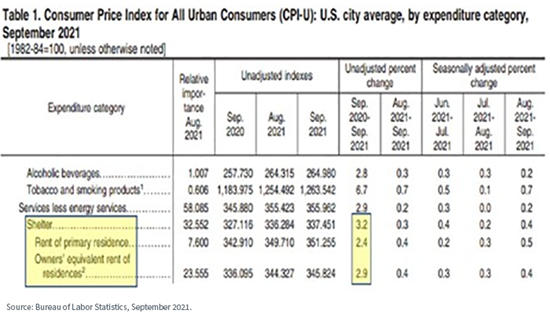
“If someone were to rent your home today, how much do you think it would rent for monthly, unfurnished and without utilities?”
As if most homeowners have any clue what their place would rent for, the BLS tabulates inflation in owner-occupied housing by asking this question about Owners’ Equivalent Rent (OER)—what homeowners think about a subject that they probably don’t think much about.
For those of us who believe house prices may be the best gauge of house prices, it doesn’t work that way.
Because of this snag in the data collection, here is what happens.
Say neighborhood rents start shooting higher. The first people to realize it are, no surprise, landlords and renters. The rest of the neighborhood—homeowners—may have some fuzzy inkling that rents are going higher, but they are not fully aware of the details. There’s no finger on the pulse.
Many homeowners who last year figured their home would rent for $1,000 are telling the BLS that it would rent for maybe the same amount—because they are unaware it could very well fetch $1,100 or $1,200 now.
Consider four recent reports on both prices and rents:
- Redfin, the listings website, wrote on September 29, 2021 that “housing market asking prices are up 12%, to an all-time high.”
- On September 30, 2021, the National Association of Realtors calculated that median listing prices were up 8.6% YoY.
- Zumper, the property search company, puts rent appreciation on both one-bedroom and two-bedroom apartments in the double digits.
- The S&P/CoreLogic Case-Shiller Home Price Index was +19.7% in the year to August, with little indication the September data will show any deflation.
These are all way off from the 3.2% increase in the all-encompassing shelter component of the CPI. It’s a matter of logic that our new high-price and high-rent world will start to be reflected, with a lag, in future CPI reports.
A Six-Handle on the October CPI Report?
There is another critical matter at hand: October CPI, which will be published on November 10, may easily exceed the monthly growth rate we witnessed last October.
In that month, CPI was flat. Come to think of it, last November was also tame (figure 2). That is a much different situation from the big inflation months of summer 2020.
Figure 2: October and November 2020 Were Not Big Inflation Months
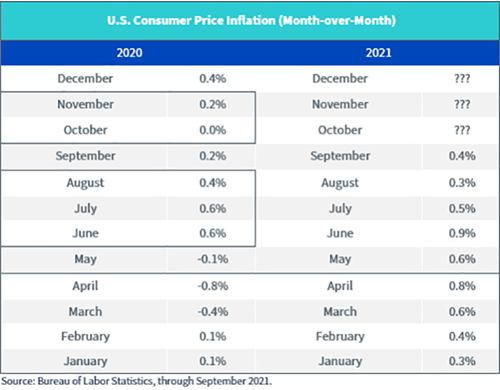
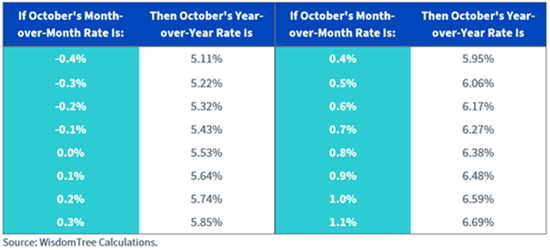
Which means that, arithmetically, it does not take much “oomph” in this October’s action to keep the year-over-year growth rate north of 5%. In fact, figure 3 lays out some very achievable scenarios that could lead to CPI touching 6%, at least for the October report.
I am not saying it’s probable, but it is certainly possible.
Figure 3: October CPI Report Scenarios
The natural concern for 2022 is whether Corporate America can maintain its profit margins in the face of rising labor costs. After all, sometimes it takes the landlord to drop the rent bomb on you before you finally get the courage to ask the boss for a raise.
A profit margin pinch is coming.
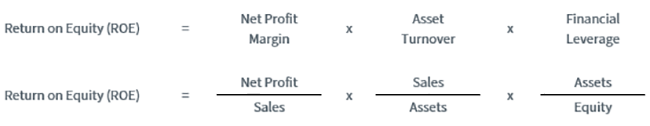
When you break apart the often cited quality smart beta factor, return on equity (ROE), you see that profit margins are a key driver of the metric. Slash margins and you have a problem (figure 4).
Figure 4: Breaking Apart ROE with the DuPont Equation
Take a look at the WisdomTree U.S. Quality Dividend Growth Fund (DGRW), which has an ROE of 28.2%, owing to robust margins. For comparison, the S&P 500’s ROE is 16.9%1.
If you like the methodology that it uses, we also have several other strategies in other asset classes that tap into the same “quality dividend growth” concept.
1 Source: WisdomTree DPD, as of 9/30/21.
Important Risks Related to this Article
There are risks associated with investing, including possible loss of principal. Funds focusing their investments on certain sectors increase their vulnerability to any single economic or regulatory development. This may result in greater share price volatility. Please read the Fund’s prospectus for specific details regarding the Fund’s risk profile.
Share & Comment
Popular Posts
Categories
Related Links