
The Pennant Winner Is…


At the start of the 2004 season, the juggernaut New York Yankees were coming off six World Series trips in eight seasons and had four championship trophies.
The team had also just pulled off a trade for 2003 American League (AL) MVP Alex Rodriguez to bolster its lineup for the better part of the next decade.1
Both recent history and logic indicated that Yankee Stadium was going to run out of space to store all the hardware they were set to win in the years to come.
New York Yankees: 1996–2003
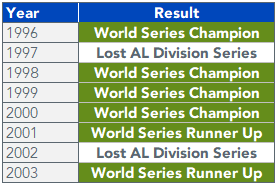
But how fortunes change.
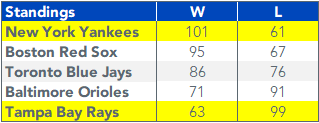
In the next 17 seasons, the Yankees captured just one AL pennant.2 To put it context, that has meant one fewer World Series appearances for the Yankees than for the Tampa Bay Rays, who were last in the 2003 AL East standings.
2003 American League East Standings
The Yankees/Rays anecdote illustrates the difficulty of imagining the future looking drastically different than what we’ve seen in recent history. The behavioral finance term for this common cognitive bias is recency bias.
FANAMA
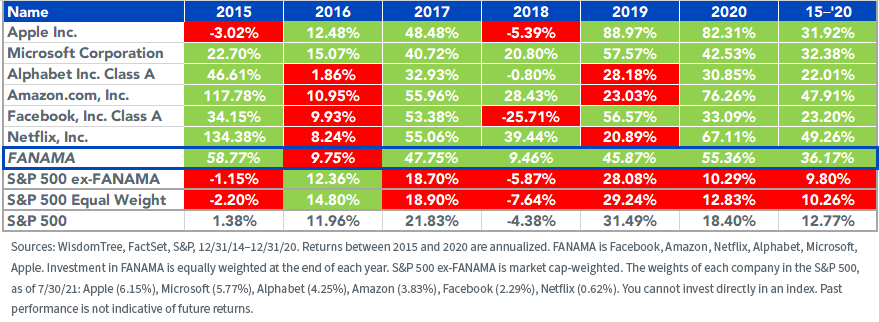
The prolonged stretch of outperformance from a handful of large tech-enabled companies—most prominently Facebook, Amazon, Netflix, Alphabet, Microsoft and Apple—has been remarkable.
Since the start of 2015, $1,000 dollars invested evenly across these six names (let’s call them FANAMA) would have grown to $6,386—over three times the $2,058 value of a $1,000 investment in the S&P 500 Index.
On an annualized basis, the S&P 500, excluding FANAMA, returned 9.80%, nearly 300 basis points (bps) less than the 12.77% return of the S&P 500 Index.
Total Returns since 2015
A whole generation of investors has only known a world in which a select few of the biggest, most recognizable companies have gone nowhere but up.
This same generation of investors also came of age thinking it was an annual rite of passage for the Yankees to play in the World Series in late October. But the future does not always closely resemble recent history.
Another common behavioral bias for investors is called the disposition effect, which refers to a tendency to sell our winners too soon and hold onto our losers too long.
Investors in FANAMA—who hopefully didn’t sell too soon—haven’t had to grapple with holding onto losers.
Yet.
Of the 36 data points of calendar year returns for these companies back to 2015, we only have four examples of negative calendar year returns—and in one of those cases that negative return outperformed the S&P 500.
Cyclical Rotation Trade
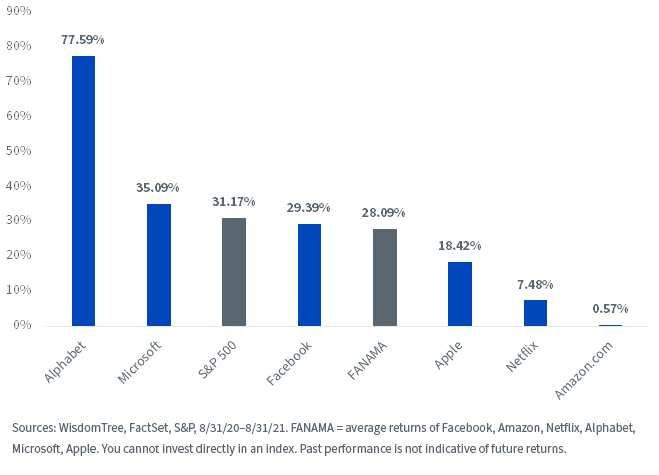
Since last September, cyclically sensitive stocks have rallied relative to the growth favorites of the last few years.
The average return of FANAMA was a not-too-shabby 28.09%. But that return lagged the S&P 500 by 3.08%. Had the trailing 12-month return for Amazon been a calendar year, that would have been its first return below 10% since 2014.
Trailing 12-Month Returns
It’s understandable that investors may be reluctant to throw in the towel on FANAMA after a blip of underperformance relative to the past six years.
On the other hand, history does support that the largest market-cap companies today are unlikely to hold their positions over the next decade.
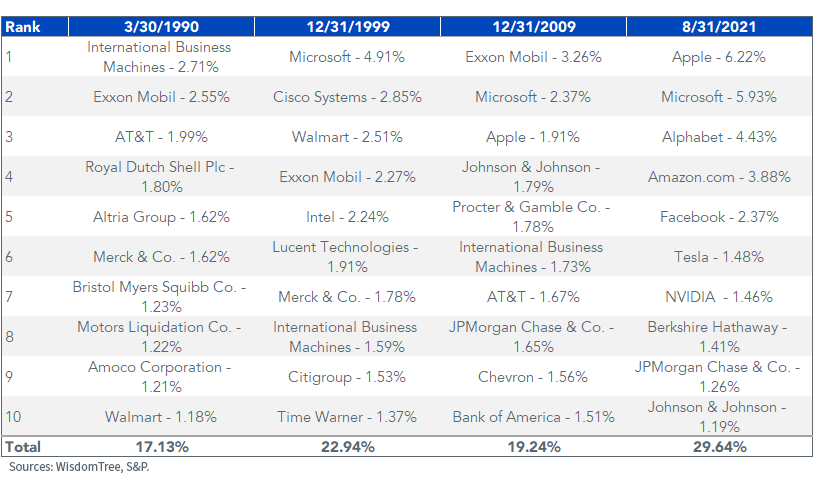
For example, not one of the top 10 companies in the S&P 500 in the early 1990s are in the top 10 of the S&P 500 today. Only four companies from 2009—Microsoft, Apple, Johnson & Johnson, JPMorgan Chase—remain in the top 10.
S&P 500 Top 10 Holdings and Weights
Conclusion
Just as we are all aware that diet and exercise will make us healthier, we are also aware of the common behavioral biases that make us extrapolate recent patterns into the future—recency bias—or that make us hold onto a loser for too long—the disposition effect.
Our awareness of these biases and the challenges of market-timing buy/sell decisions is why WisdomTree favors systematic, rules-based investment strategies that mitigate them.
One such strategy is our WisdomTree U.S. Quality Dividend Growth Index.
The annually rebalanced Index holds a diverse basket of 300 dividend paying companies that have high profitability, low leverage and strong growth characteristics.
We think an approach such as this can fulfill, or round out, a core position in a portfolio without making any outsized bet on single names.
In a follow-up blog post, we will take a deeper dive into how FANAMA have contributed/detracted from returns of our quality dividend growth index.
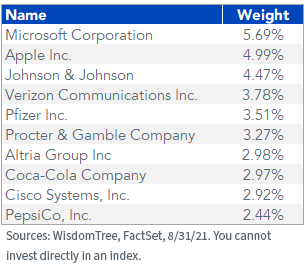
Top 10 Holdings: WisdomTree U.S. Quality Dividend Growth Index
1When the Yankees traded for Alex Rodriguez, he had seven years left on a 10-year contract he had signed in December 2000 with the Texas Rangers.
2The winner of the American League pennant advances to the World Series to play the winner of the National League pennant.
Share & Comment
Popular Posts
Categories
Related Links