
Old Faithful


Old Faithful is the folksy name given to a geyser in Yellowstone National Park. It comes from the consistency of its eruptions.
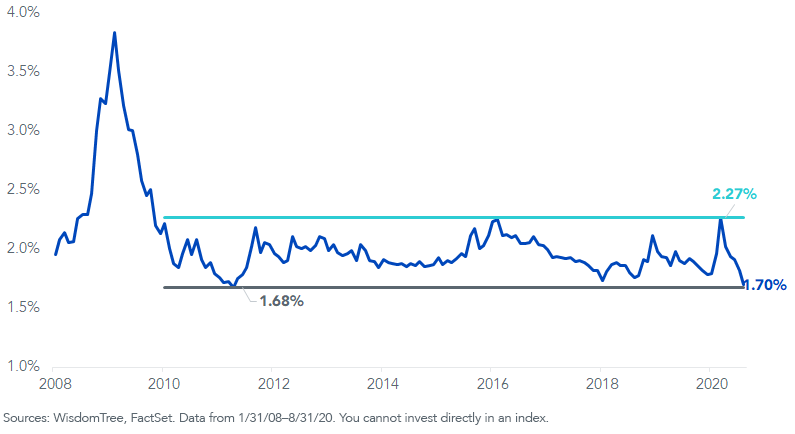
In the years since 2009, which saw the worst calendar-year drop in S&P 500 dividends in history, the S&P 500 dividend yield has been remarkably stable. One could call its consistency akin to Old Faithful’s.
The Index’s yield has hovered close to 2%. A low point of 1.68% was reached in April 2011, and a high of 2.27% was touched at the end of March this year—just a hair higher than the 2.26% at the end of February 2016.
Over the course of slightly more than 10 years, the band on the S&P 500 dividend yield was less than 60 basis points (bps).
Historical S&P 500 Dividend Yield
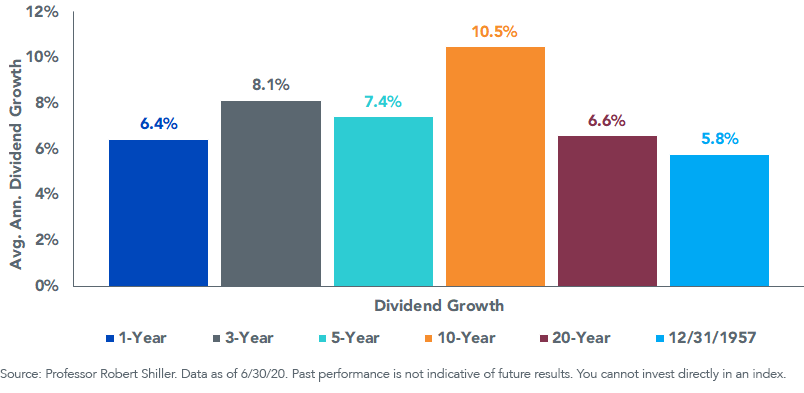
More Than 10% Annualized Dividend Growth
This valuation stability comes amid the backdrop of remarkable price gains.
The S&P 500 Index had 11.6% annualized price returns over the decade ending June 30, 2020. With the substantial rise in the Index’s price accompanied by little change to the overall yield, investors shouldn’t be surprised to find that the Index’s dividend has grown by a similar amount—10.5% annualized.
For all the talk of share buybacks as the preferred source of capital distributions in the U.S., the 10.5% annualized increase in S&P 500 dividends over the past 10 years is nearly double the historical rate of 5.8% going back to 1957.
S&P 500 Index Dividend Growth
Increasing Weight of Non-Payers
Due to the recent outperformance of select favored “stay-at-home” growth companies, there has been a significant increase in the weight of non-dividend payers in the S&P 500 this year. The percentage of the Index’s weight in non-dividend payers is now higher than at any point since the early 2000s.
While many investors are taking aim at replacing the paltry yields on fixed income allocations with higher-yielding equities, a higher share of market cap-weighted indexes is being allocated to companies that pay no dividends at all. Should this trend continue, it could push the Index’s dividend yield further away from its 2% historical level.
Historical Percent S&P 500 Non-Dividend Payer Weight
Weighting by Dividends
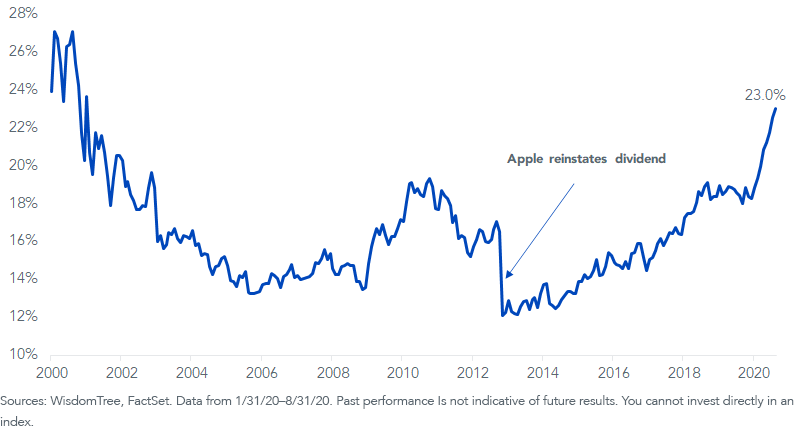
In the below chart, we show that by simply removing the 23.0% weight of the S&P 500 that does not pay a dividend, the Index’s yield improves 51 basis points—from 1.70% to 2.21%.
The WisdomTree U.S. LargeCap Dividend Index takes this emphasis on dividends a step further. The Index is reconstituted each December to reflect the performance of the 300 largest market-cap dividend payers in the U.S. Selected constituents are then weighted by their cash dividends.
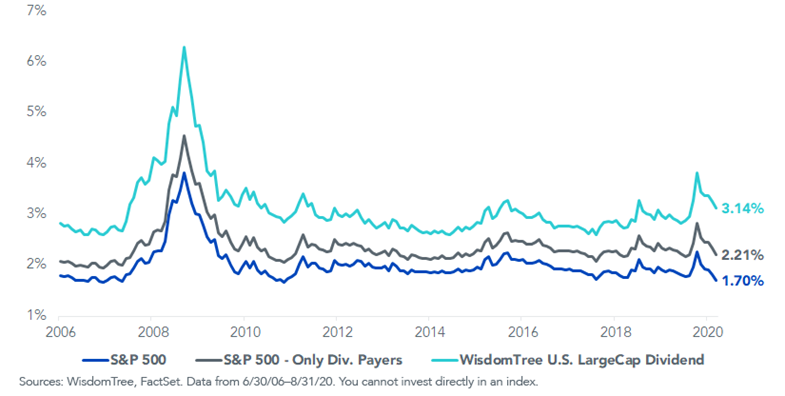
Historically, this has resulted in an average yield spread of 111 basis points for the WisdomTree U.S. LargeCap Dividend Index relative to the S&P 500.
Historical Index Dividend Yield
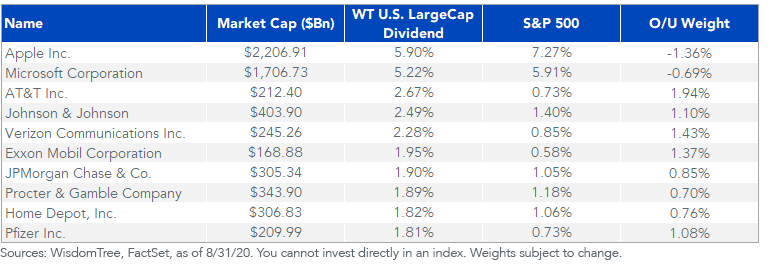
Weighting for the WisdomTree Index is a “modified” market-cap approach, where the largest dividend payers—which tend to be the largest companies—earn the greatest weights. As a result, Apple and Microsoft are the Index’s two largest holdings.
While the Index does not give the greatest weight to the highest yielders, the combined process of removing exposure to non-dividend payers and weighting by cash dividends imposes a systematic valuation discipline that increases the Index’s dividend yield.
Top 10 WisdomTree Index Weights
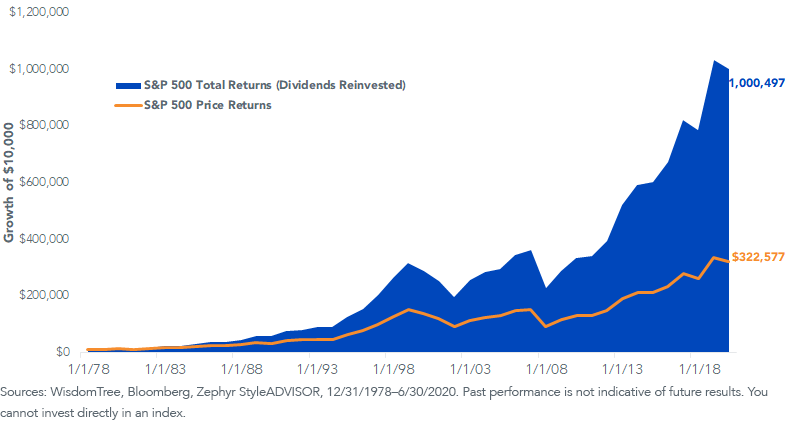
Over the long run, the compounding of reinvested dividends drives the vast majority of total returns. What the WisdomTree U.S. LargeCap Dividend Index does is give greater emphasis to what matters most—cash dividends distributed to shareholders.
Compound Dividend Reinvested vs Price Returns (68% of Market Returns from Reinvested Dividends)
Conclusion
Just like Old Faithful, which didn’t earn its reputation for the size of its eruptions but rather their consistency, investors are unlikely to marvel at dividend investing as a way to triple an initial investment overnight.
What can impress is the consistency of dividend payments and dividend growth.
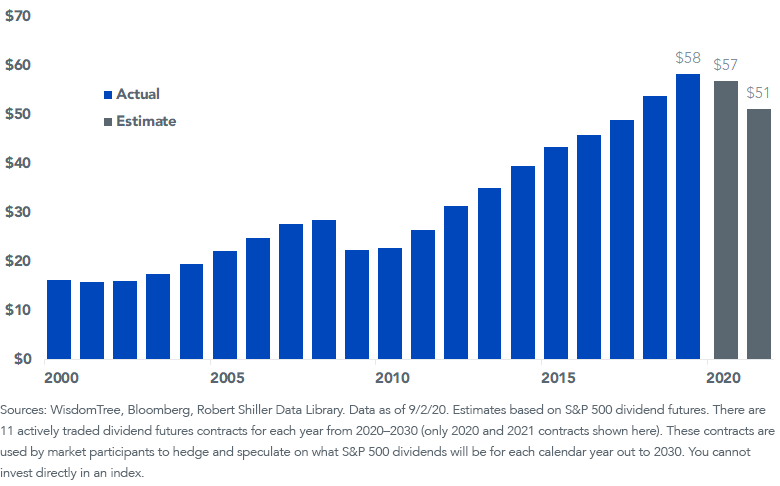
The coronavirus pandemic has put an unprecedented strain on businesses, forcing roughly 60 S&P 500 constituents to either cut or suspend their dividends this year. Even so, S&P 500 dividend futures estimates only forecast a 2% cut in dividends for 2020 and 12% for 2021 versus 2019 levels.
For an arguably worst-case scenario—a once-in-a-century pandemic—these anticipated drops seem modest, in our view. And if the dividend growth following the financial crisis is any guide, dividend payouts may accelerate once the economy begins an eventual turnaround.
S&P 500 Divided ($ Per Share)
Share & Comment
Popular Posts
Categories
Related Links