
Value Stocks Need a Whiff of Inflation


“Don’t fight the Fed” is a mantra that seems truer with each passing year.
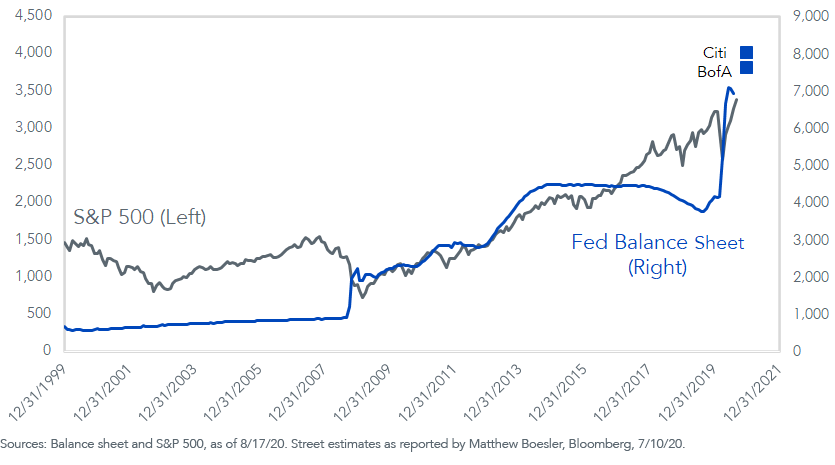
Every strategist worth their salt has a chart that looks something like figure 1.
To show the direction the S&P 500 Index could take in the next few months, I added to the Federal Reserve’s (Fed) $6.95 trillion balance sheet the year-end forecasts of BofA ($7.6 trillion) and Citi ($8.0 trillion). Those estimates pale in comparison to some of the numbers put on the table a few months ago, when a chunk of the Street was calling for the balance sheet to levitate up to $10 trillion or even $11 trillion, but they are still considerably higher than current levels.
Nevertheless, a continuation to either BofA’s or Citi’s target may be enough to get it done for the bulls.
Figure 1: Federal Reserve Balance Sheet ($ billion)
With so many hyper-focused on Covid-19’s effects on 2020 activity, only a few lonely souls can envision us back on airplanes, in hotels and attending conferences in, say, 2021.
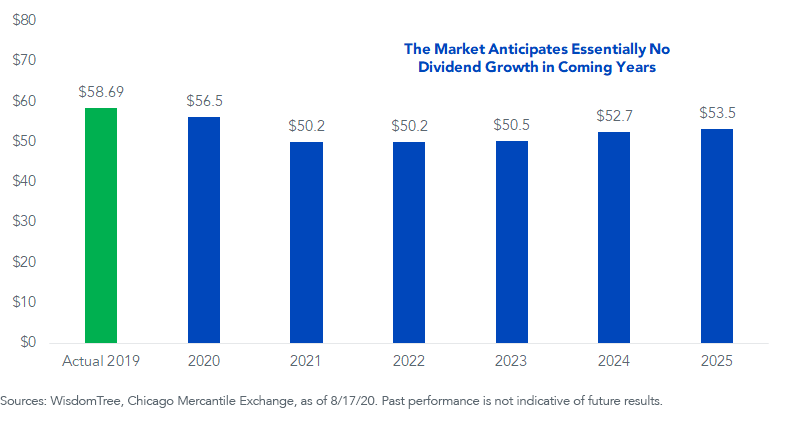
Look at the dreary prognosis of the S&P 500 dividend futures market.
In 2019, the S&P, which now trades at 3,383, paid $58.69 in index-level dividends. The Street is so sobered by 2020’s headlines that it is looking at “out-year” 2025 dividends that are lower than the amounts witnessed last year (figure 2).
Figure 2: S&P 500 Dividends and Futures Market Expectations
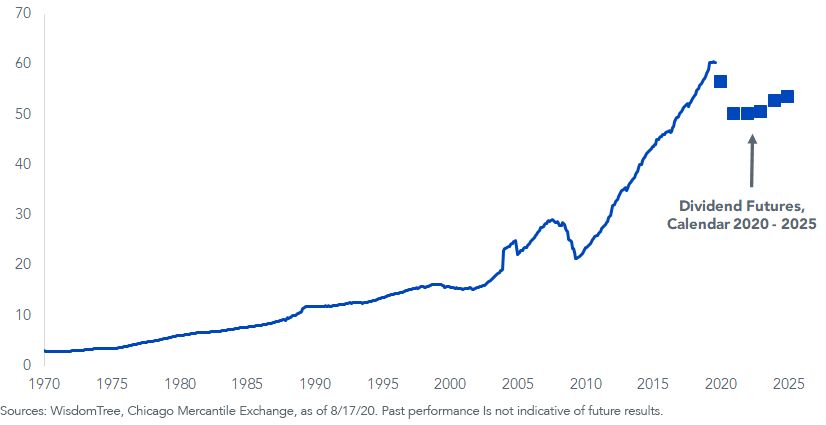
That is actually heartening news for bulls because it means upside revisions could be coming. After all, S&P 500 dividends have grown about twenty-fold since 1970 (figure 3). To witness lower dividends in 2025 than we saw in 2019 would be historically anomalous.
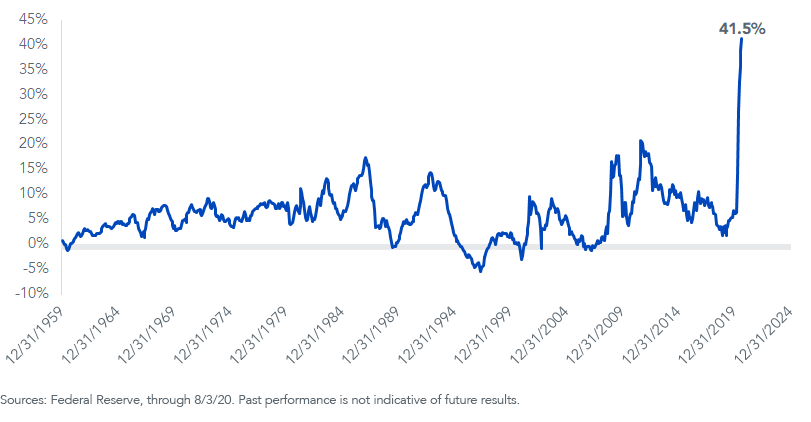
Perhaps most critically, so many investors have had poor demographic data drilled into their heads for so long that they have convinced themselves that no amount of money supply expansion will ever show up in consumer price inflation.
Not even this much:
Figure 3: U.S. M1 Money Supply (YoY)
According to Moody’s, the average Baa-rated bond—which represents the lowest rung of the investment-grade spectrum—yields 3.51%. Suppose we do enter an environment where inflation is higher, but not crazily so. Anything above 3.51% and your real debt burden starts going down, even if nothing has changed in a business’s prospects.
Let’s think about what happened to the market’s dividends when inflation did its work in a punk economic environment: the 1970s.
In 1970, the S&P 500 paid index-level dividends of $3.13. That rose gently to $3.68 in 1975, but then took off, hitting $6.20 in 1980, about double the 1970 level. It wasn’t economic dynamism that did the trick; rising prices did it.
Mark Twain famously declared that “history doesn’t repeat itself, but it often rhymes.” Maybe the blue dots will rise if the investing public receives its inflation surprise (figure 4).
Figure 4: S&P 500 Index-Level Dividends
The plays for the 2009–2020 bull market were companies that could thrive in a disinflationary environment characterized by a lack of firms exhibiting growth. The Technology and Communications Services sectors, which were among the few groups able to demonstrate that elusive growth, handily outperformed.
But if we are entering a period of money supply-induced inflation, the beneficiaries could be sectors such as Energy and Basic Materials, with Financials finding a bid if the yield curve steepens.
In other words, value stocks.
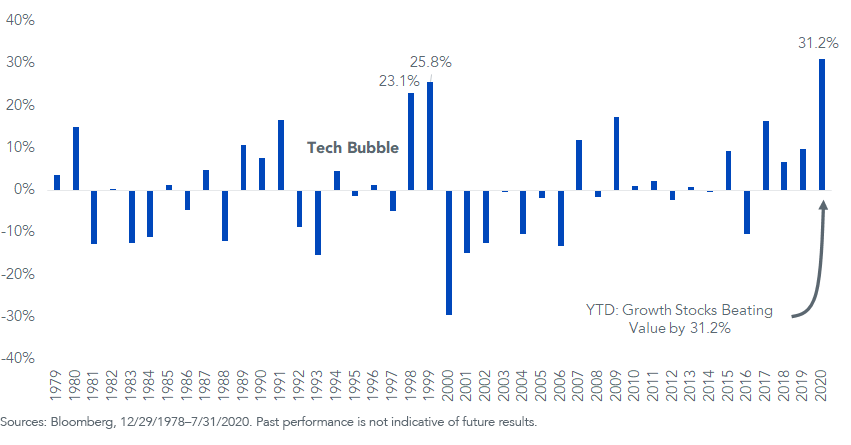
The first seven months of 2020 witnessed the Russell 1000 Growth Index defeat its value counterpart by a margin reminiscent of the tech bubble years.
The thing about the early 2000s is that the period marked the end of that bubble and the beginning of the Commodities Super-cycle, the window from around 2000 to 2008 that witnessed the prices of copper, oil, houses, cars—and just about everything else—start heading skyward.
Notice what happened to the green bars in figure 5 during that era? A whiff of inflation is what may allow Value stocks to get on top.
Figure 5: Annual Returns, Russell 1000 Growth Minus Russell 1000 Value
Share & Comment
Popular Posts
Categories
Related Links