
Heading in the Right Direction


As we continue to be bombarded with headlines and news stories on a 24-7 basis, sometimes it’s difficult to know what to focus on in terms of economic numbers. I’m sure everyone has their favorite indicator to watch and comment on. But in our current investment landscape, I think there are two data releases that investors should gravitate toward: weekly jobless claims and the Consumer Price Index (CPI). What’s more, the latest reports for these indicators seem to show the economy could be heading in the right direction.
In these two data series investors have a forward-looking, or leading, indicator in jobless claims, and one that former Federal Reserve (Fed) Chair Alan Greenspan used to say is like looking in the rearview mirror, the CPI. In other words, they offer two distinct perspectives on the economy. Perhaps more importantly, they carry the potential to shape the rate outlook for the U.S. Treasury (UST) market.
Weekly Jobless Claims
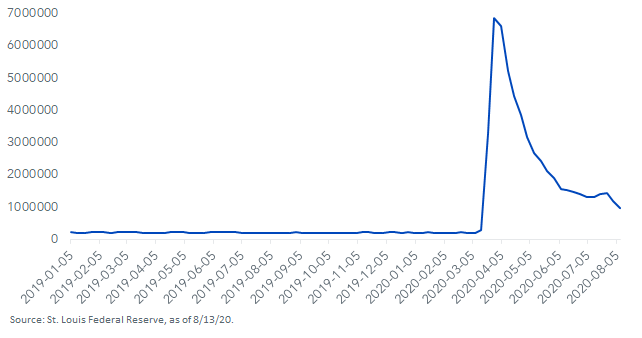
Let’s take jobless claims first. This series is arguably the more important of the two I’m discussing here. Not only is it part of the overall Leading Economic Index (LEI) , but it is also one of the most “real time” data snapshots we can get. The claims data graph really sums this year up in a nutshell. Before the COVID-19-related shutdowns, the number of claims was in the 200,000 to 250,000 range. Then the spike hit, bringing the level up to an unprecedented level of almost 7 million in late March. The reverse V-shaped decline took the figure down to about 1.5 million, where it stalled until the last two weeks. Last week, the tally finally broke through the 1.0 million threshold for the first time since March, coming in at 963,000.
U.S. CPI & U.S. CPI ex-Food and Energy
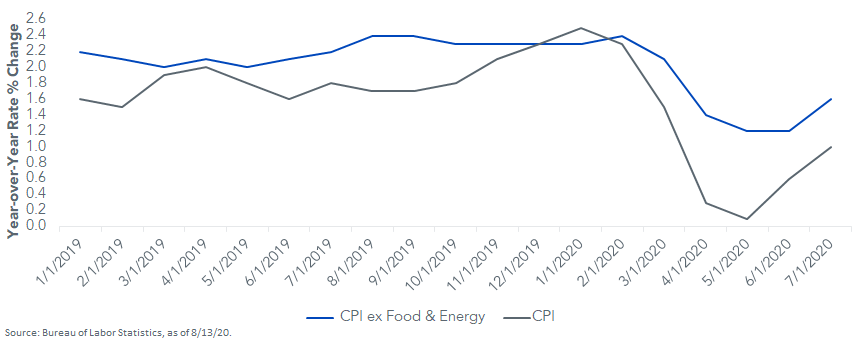
How about inflation? For both the overall and core measures, the CPI data revealed a measurable bounce back in July. In each instance, the inflation gauges posted their highest year-over-year rates since March. I prefer to focus on the CPI, less food & energy. In July, this core measure rose 0.4 percentage points to 1.6%, in effect ending the descending trend that had been in place the last four months.
Conclusion
While these two data series offer rays of economic hope, both graphs underscore that there’s still more “wood to chop” to get the U.S. economy back to its February footing. Nevertheless, let’s take some good news when we can get it, right? The Treasury market seemed to take notice, as the UST 10-year yield moved over 0.70%, as of this writing—a 20 basis point reversal after hitting its all-time low last week.
Unless otherwise stated, data source is Bloomberg, as of August 13, 2020.
Share & Comment
Popular Posts
Categories
Related Links