
It May Not Be Dot-Com, but the Parallels Are Building


It happened. The stock market repeated history, sort of.
It was 30 years ago that CNN broadcasted the images of the First Gulf War into our living room after Iraqi dictator Saddam Hussein invaded Kuwait in August 1990. The S&P 500’s three-year rally from the 1987 crash had already started to peter out earlier that summer, but it was the war-induced oil spike and memories of 1970s stagflation that gave stocks the real kick. The S&P reeled lower, falling 19% in less than three months.
This is where the history repeating itself part comes in.
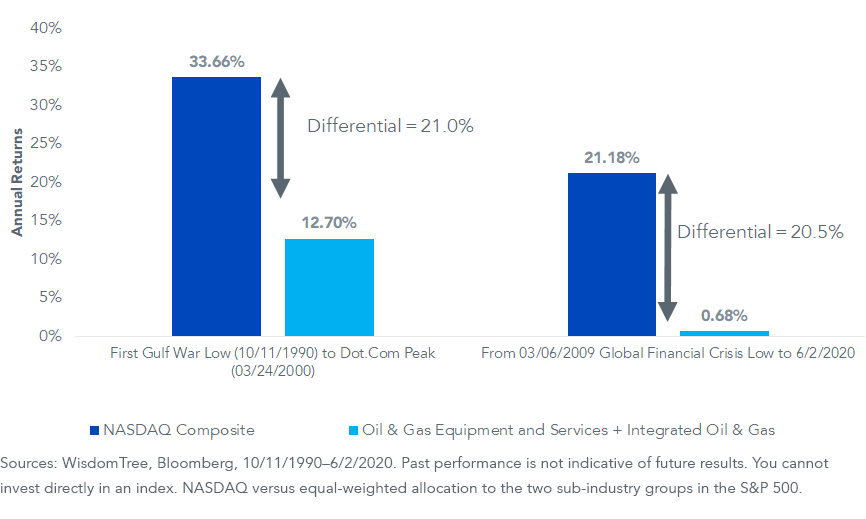
From the Gulf War low in October 1990 to the March 2000 dot-com bubble high, the tech-heavy NASDAQ outperformed a basket of oil and gas industries by 21% per year (figure 1). Remarkable.
Guess what? The current run took the S&P 500 to 3,384, followed by the February/March crash, but we are right back to 3,212. It’s like COVID-19 never happened. Dating to the March 2009 lows, this 11+ year move has witnessed a performance gap of more than 20% per year between the NASDAQ and the oil groups. It happened again.
Figure 1: 1990s Bull Market vs. 2010s Bull Market
I don’t want anyone to walk away from this blog and say “that WisdomTree guy says this cycle looks just like dot-com.” Look, the dot-com bubble had a lot of pie-in-the-sky stocks and, frankly, frauds. Today’s Big Tech companies are legitimate businesses with legitimate business models.
But come on—20% outperformance per year for 11 years. Are fossil fuels necessarily this generation’s iteration of the newspaper business? Possibly, maybe even probably, but not definitely. The last time the S&P 500 Energy Index was priced for dead like this, it was prime time to get out of the NASDAQ and brace for crude oil’s multi-year surge.
From the stock market’s March 24, 2000 high to its subsequent peak on October 9, 2007 in the early stages of the global financial crisis, each of the oil and gas subsectors in that chart either doubled or tripled; the NASDAQ was still in the red.
Sure, there is a reason for the Energy sector’s woeful performance these days: climate change, divestment programs, being public enemy number one. It’s bleak, no doubt about it. But this isn’t the first time the Tech sector was untouchable and Energy was toast.
Here’s a gem from CNN Money in “OPEC Disappoints, Oil Slides” on November 30,1998:
Kuwaiti Oil Minister Sheikh Saud al-Sabah said Saturday that he feared (oil) prices could plunge to the $5 to $7 a barrel range.
West Texas Intermediate crude oil closed at $11.24 per barrel the day that was published. The market thought it was swimming in the stuff; that single-digit oil was here to stay. Then China happened. In retrospect, late 1998 was a brilliant time to accumulate energy stocks.
Enough about this cycle’s pain trade, Energy. How about the one that won’t stop zooming?
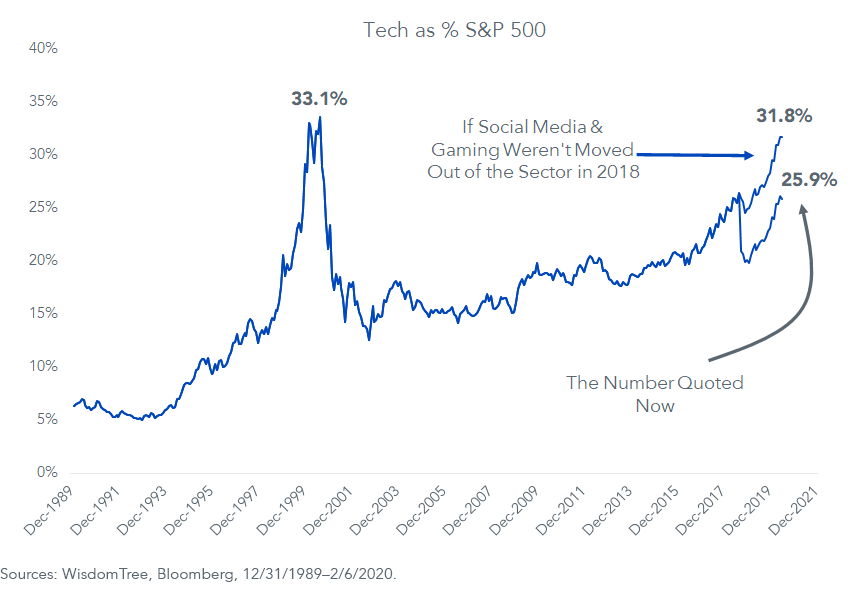
We have to discuss the matter of the Tech sector’s absolute dominance of the S&P 500 at the moment. It was more than a third of the Index at the dot-com peak. Today it is 25.9%.
Or is it?
A funny thing happened on the way up this bull market ladder: In September 2018, Standard & Poor’s reconfigured its sector compositions. The old Telecom, the phone company sector, got a new name—Communications—and inherited Activision, Electronic Arts, Facebook, Google-parent Alphabet, Twitter and Snap1 (of Snapchat social media fame). If those companies were still classified as they were two years ago, Tech would be 31.8% of the S&P 500; essentially the same weight as it was at the 2000 dot-com peak (figure 2).
Figure 2: Technology Sector as % of S&P 500
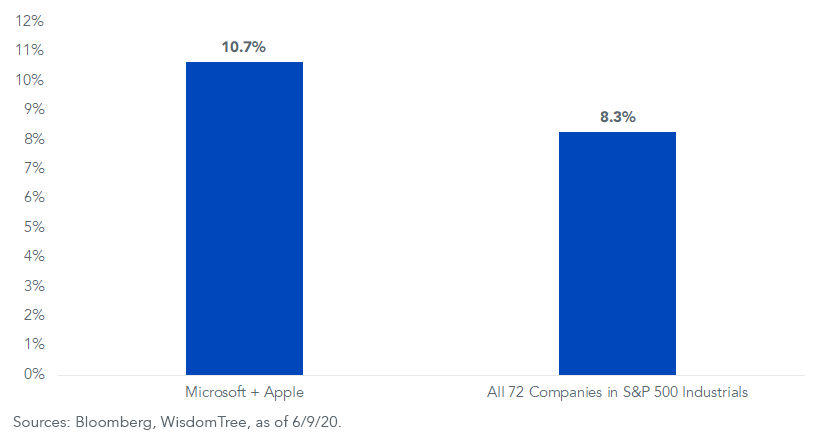
The market is top heavy too. For example, Microsoft and Apple alone comprise a greater proportion of the S&P 500 then all 72 companies in the Industrials sector combined, with room to spare (figure 3).
Figure 3: Weight in S&P 500
Remember a generation ago when “The General”—General Electric—was top of the house, the largest corporation in the world, unstoppable? It’s just as hard for me to conceptualize Microsoft and Apple dying on the vine as it is for you, but then again, that was the case for GE. It wasn’t the first company to fall from grace, and it won’t be the last.
Indexes like the S&P 500 are top-heavy. The play is a skew toward value stocks, which allows for smaller exposure to today’s popular tech giants. Perhaps our best-known value fund is the WisdomTree U.S. High Dividend Fund (DHS). It still has 15% in Tech, but by nature of requiring a large dividend, it has zero or light exposure to the firms that top the S&P 500. For example, as of May 31, 2020, you get a 4.1% weight in IBM (dividend yield of 4.9%) and a 2.9% weight in Cisco Systems (dividend yield of 3.0%), but there is no exposure to firms like Facebook, Twitter or Tesla because of their lack of dividends. Similarly, though Microsoft and Apple have dividends, they don’t have high dividends. They are not in DHS at the moment either.
1As of June 26, 2020, Activision, Electronic Arts, Facebook, Google-parent Alphabet, Twitter and Snap each have 0% holdings in the WisdomTree U.S. High Dividend Fund (DHS).
Important Risks Related to this Article
There are risks associated with investing, including possible loss of principal. Funds focusing their investments on certain sectors increase their vulnerability to any single economic or regulatory development. This may result in greater share price volatility. Please read the Fund’s prospectus for specific details regarding the Fund’s risk profile.
Fund composition is subject to change. References to specific securities and their issuers are for illustrative purposes only and are not intended to be, and should not be interpreted as, recommendations to purchase or sell such securities.
Share & Comment
Popular Posts
Categories
Related Links