
The Topsy-Turvy S&P 500 Earnings Picture


When you look at Wall Street’s consensus S&P 500 earnings estimates for year-end, it doesn't look realistic.
It happens every year, doesn’t it?
The example in figure 1 is one of the more egregious I’ve seen. I am hard-pressed to see how S&P 500 earnings in this frustrating pandemic will only fall to $125 in calendar 2020.
Figure 1: S&P 500 Index Earnings per Share
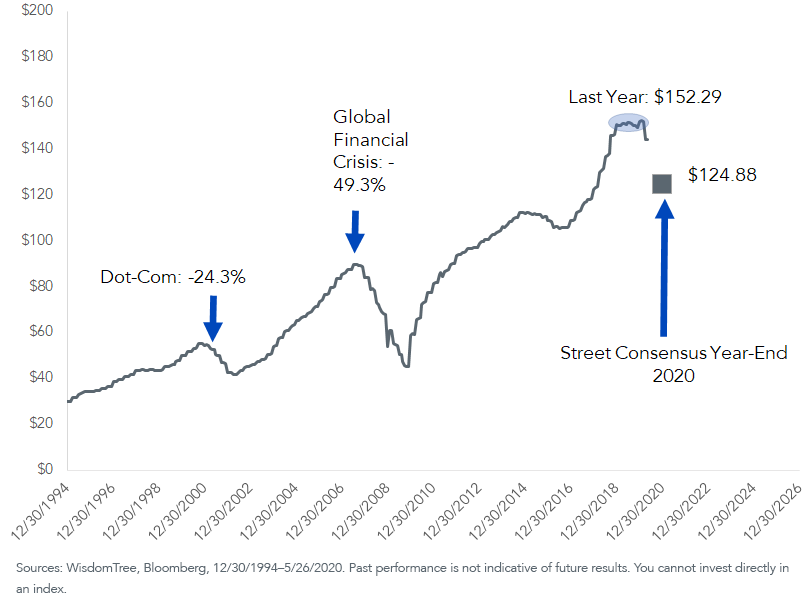
Hold this chart in your head for a moment.
Nobody—nobody—I’ve spoken to or work with is taking $125 at face value. Fortunately for the bulls, most expect some lower number, so the market is unlikely to be surprised as companies reveal ugly earnings calls from CEO living rooms. Nevertheless, I am reluctant to just brush aside the harrowing prospect of sub-$100 earnings as “it’s okay because the market already expects it.” Not for an S&P 500 that trades around 3,000.
The once hoped-for “V-shaped” recovery has given way to anticipation of a long slog. The only depression remotely comparable to this is the Global Financial Crisis (GFC), which witnessed S&P 500 earnings fall 49%. If we get a repeat here—no better, no worse—then brace for something in the $70s at the depths of the carnage, perhaps in 2021 or 2022. That assumes U.S. and global business prospects aren’t still grinding lower come 2023.
My concern is what happens three months from now, when Q2 earnings are announced. That may be more revealing than the red ink showered on earnings guidance during Q1’s reporting season.
It will add to my current dilemma: How to put a proper price-to-earnings (P/E) ratio on this market?
Consider that the S&P 500 trades for 19.8 times peak earnings of $152.49 from a few months ago. Figure 2 shows the multiple for the other scenarios.
Figure 2: Pick the P/E
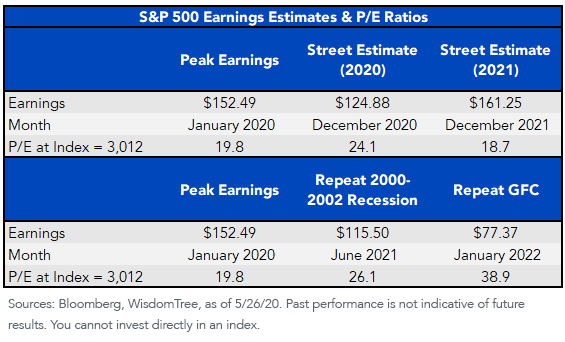
The amalgamation of analysts’ estimates of $124.88 for calendar 2020 total earnings equates to a forward P/E multiple of 24.1. That’s pretty high in any situation, let alone this one.
The Street also needs to get around to revising its outlandish $161.25 earnings estimate for 2021.
Suppose the S&P 500’s earnings decline by the same order of magnitude as the 2000–2002 bear market. In that case, the low point would come in summer 2021, at $115.50. Its P/E in that scenario is 26 times those future earnings. And if this crisis witnesses an earnings collapse akin to what we witnessed in the GFC, the P/E essentially doubles to 38.9.
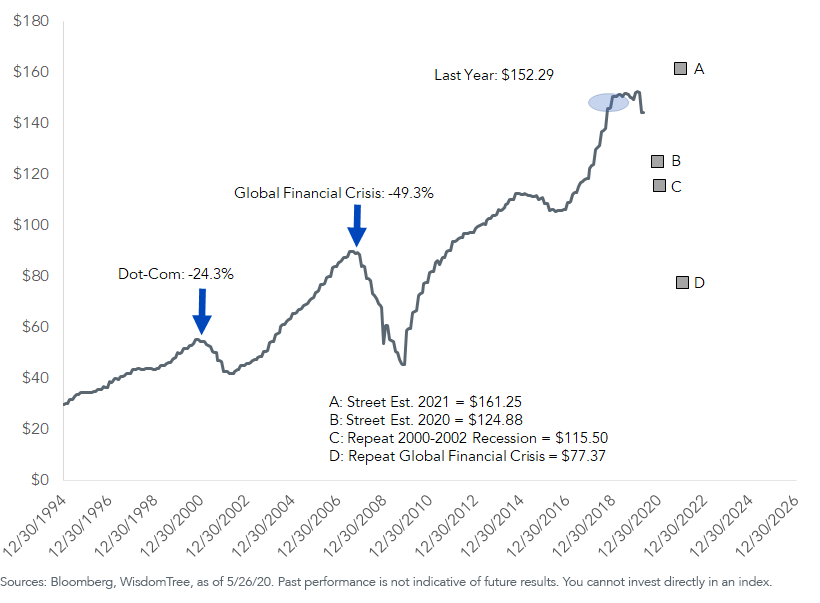
Back to our first chart. Here it is, with the various scenarios.
Figure 3: S&P 500 Earnings
What is propping up the Street’s spirits?
Still priced for perfection (the S&P 500 Growth Index’s P/E is about double its value counterpart), the dirty little secret about many of this market’s darlings is that some of their earnings have stagnated.
Of the infamous FAANGs (Facebook, Apple, Amazon, Netflix and Google-parent Alphabet), two are expected to witness earnings decline this year (Alphabet and Amazon). Facebook, which reported earnings per share of $6.43 for 2019, is expected to see earnings of $7.28 this year. But you have to pay the piper if you want it. The stock changes hands for $234.
Amazon’s 2019 earnings per share of $23.01 are now being penciled in a few dollars lower, at $19.50 for this year, owing to COVID-19 cost pressures. The stock is at $2,432. Shave about $500 off the share price and it will still trade for 100 times this year’s earnings.
Alphabet (Google’s parent) had earnings per share of $43.65 in 2018, $49.16 in 2019 and the consensus is for $41.38 this year. The stock is at $1,430.
These firms—long the market leaders—are the ones that appear particularly vulnerable to an extended grind lower in analysts’ earnings revisions.
The case for owning them has been predicated on their ability to grow in a stagnant environment, but two of the five don’t appear as if they are going to do that, if the Street’s collective forecast is correct. And for companies like Netflix, which thrive when we are all stuck at home, you have to pay 64 times 2020 earnings for the privilege.
The market may soon realize that valuations do eventually matter, just as they have for time immemorial.
Share & Comment
Popular Posts
Categories
Related Links