
As the World Turns


What a difference a month makes in bond-land. Just when investors thought U.S. Treasury (UST) yields were on the verge of moving even lower—BAM!—a rather visible sell-off ensued. In the process, one could be left wondering what happened to create such a shift in sentiment or if it is just another case of “as the world turns.”
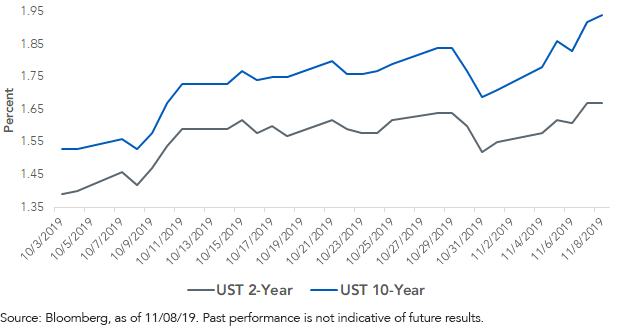
Let’s get some perspective on these recent developments. In early October, the UST 10-Year yield was challenging the 1.50% level again with the thought being that, perhaps, it would pierce through this level, much as it had a month earlier right after Labor Day. That was not to be the case. Was the Treasury market sending investors a signal about just how low rates could go? Interestingly, just a few weeks after this Labor Day low was registered, the UST 10-Year yield surged over 40 basis points (bps). Sound familiar? As of this writing, the UST 10-Year yield is up more than 40 bps from its October low. As of this writing, 1.94% yield takes us back to where the yield resided right after the Federal Reserve’s (Fed) first rate cut in late July.
U.S. Treasury Yields
What is the root cause? Usually, one looks toward the economy or any shifts in Fed policy, but the real catalyst was the announcement that the United States and China had come to a “Phase 1” agreement in trade negotiations. We’ve all seen firsthand the back and forth on this issue, so some cynicism is warranted. However, this time around, it seemed that maybe there could be some progress. In fact, headlines continue to suggest that Phase 1 may actually become a reality.
Then, economic data implied that the recession many market participants were anticipating sooner rather than later might not be coming anytime soon after all. Real GDP for the third quarter showed the U.S. economy maintaining a growth pace close to +2%, while the October jobs numbers underscored that the labor force setting remained quite solid, providing much-needed support for consumer spending.
Conclusion
So, where do we go from here? If the sell-off were to continue, the five-year Fibonacci retracement would put the UST 10-Year yield through the 2% threshold, with the next level being 2.0596%. The one-year analysis has 2.0947% as the next stop (you get the picture). This brings us back to pre-Fed-rate-cut days. But if history is any guide, be flexible with your rate call—the Twittersphere is always looming out there.
Unless otherwise stated, data source is Bloomberg, as of November 8, 2019.
Share & Comment
Popular Posts
Categories
Related Links