
How to Reduce Beta with a Multifactor Approach


June 28 marked the second anniversary of the WisdomTree U.S. Multifactor Fund (USMF).
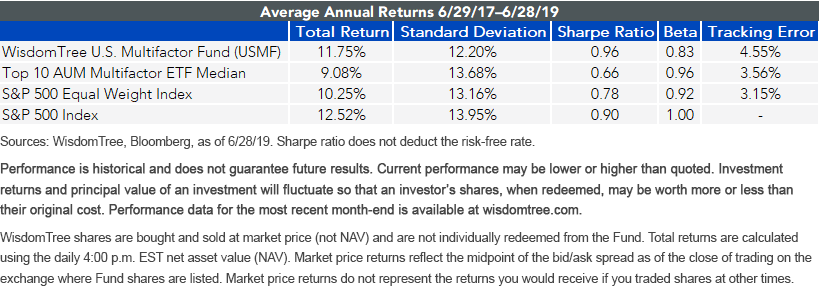
USMF’s performance has proven resilient amid volatile market conditions and factor performance. Its balanced factor exposure and stock selection using fundamental and technical factors has allowed it to keep pace with the market with lower volatility. The S&P 500 Index (S&P 500) has seen multiple moves greater than 13% on both the up and down sides over this period.
USMF can diversify a portfolio’s core U.S. allocation given its higher risk-adjusted return, tracking error and beta of 0.83 against the S&P 5001. This can be attractive as the economy heads into the latter part of the cycle, where diversified asset allocation becomes increasingly important.
USMF Outperforms Largest Multifactor Products
Multifactor investing is growing in popularity. Assets under management for the 10 largest multifactor exchange-traded funds (ETFs) in the market have grown north of 23% over the last 12 months, totaling $12.9 billion. Performance across these ETFs has been mixed, as their objectives and methodologies are diverse.
Below, we highlight these statistics and compare USMF to both the S&P 500 and S&P 500 Equal Weight Index (S&P 500 EW).
We believe the S&P 500 EW is a better benchmark for USMF because it, too, deviates from market cap weighting. Market cap-weighted indexes tend to exhibit significant contribution to performance from a limited number of companies given their more concentrated weighting.
It’s always interesting to see how deviating from market cap weighting reduces the S&P 500 EW’s beta to the S&P 500, since it doesn’t have concentrated bets in a handful of companies. The same logic can also be applied to USMF, whose weighting and stock selection allows it to maintain a lower beta to the S&P 500 while having better risk-adjusted return.
This is the type of differentiated return profile that we favor to complement a core U.S. equity exposure.
For standardized performance of USMF, please click here.
Fundamental Differences
One of USMF’s objectives is to provide investors with a balanced exposure to the following six factors: Low Correlation, Momentum, Quality and Value as part of the explicit methodology, along with Size and Low Volatility inherent in the methodology’s weighting. A balanced exposure to all factors should pay off in the long term, as academic research shows all factors tend to outperform in both absolute and risk-adjusted terms.1
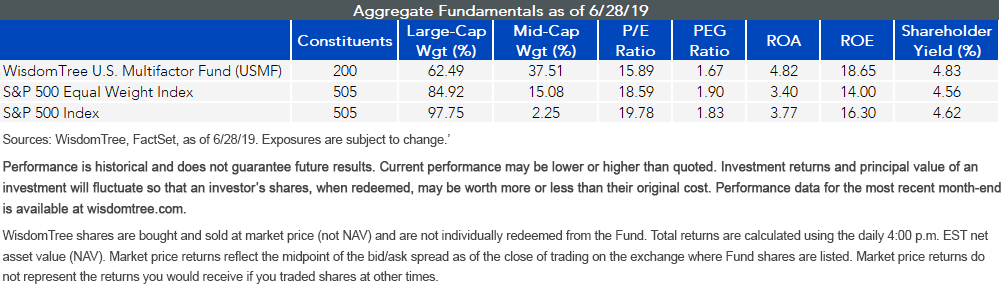
USMF’s portfolio achieves its desired aggregate characteristics compared to both a cap-weighted and equally weighted benchmark. As shown below, USMF has a significant mid-cap tilt and higher return on assets (ROA) and return on equity (ROE) and a lower aggregate P/E ratio than both the S&P 500 EW and S&P 500. These measures show balanced exposure to Size, Quality and Value.
Another of USMF’s goals is to generate excess returns through stock selection using factors as an alpha signal. Over the last 24 months, factors, as broadly defined, have experienced mixed performance. Despite outperforming over the long run, not all factors will always outperform. Defensive factors, like Quality and Low Volatility, outperformed the more aggressive ones, like Value and Size, as expected during the latter part of the economic cycle. The Momentum factor also benefited from the extended trends and beta-type rallies in the market over this period. Factor performance is not only driven by the equity markets, as some factors are more sensitive to interest rates than others. Therefore, we favor a balanced factor exposure.
Thanks to its stock selection, USMF, through a less concentrated and more diversified basket, has been able to keep pace with an equity market that has been driven by a handful of high market-capitalization companies over the last two years.
In short, after 24 months of live performance, USMF has met the goals that were set out when it was launched and has the potential to generate higher absolute returns over the long run.
Unless otherwise stated, all data sourced is Bloomberg, 6/29/2017 - 06/28/2019.
1Source: Kenneth R. French Data Library.
Important Risks Related to this Article
There are risks associated with investing, including possible loss of principal. Investing in a Fund exposed to particular sectors increases the vulnerability to any single economic, political or regulatory development. This may result in greater share price volatility. Due to the investment strategy of the Fund, it may make higher capital gain distributions than other ETFs. Please read the Fund’s prospectus for specific details regarding the Fund’s risk profile.
Diversification does not eliminate the risk of experiencing investment losses.
Share & Comment
Popular Posts
Categories
Related Links
Alejandro Saltiel joined WisdomTree in May 2017 as part of the Quantitative Research team. Alejandro oversees the firm’s Equity indexes and actively managed ETFs. He is also involved in the design and analysis of new and existing strategies. Alejandro leads the quantitative analysis efforts across equities and alternatives and contributes to the firm’s website tools and model portfolio infrastructure. Prior to joining WisdomTree, Alejandro worked at HSBC Asset Management’s Mexico City office as Portfolio Manager for multi-asset mutual funds. Alejandro received his Master’s in Financial Engineering degree from Columbia University in 2017 and a Bachelor’s in Engineering degree from the Instituto Tecnológico Autónomo de México (ITAM) in 2010. He is a holder of the Chartered Financial Analyst designation.