Are You Overpaying to Manage Volatility in Your Portfolio?


If you ask investors whether they think that low volatility is a good strategy for a particular equity market, it is interesting to consider what they might be thinking of through the lens of behavioral finance.
Option 1: They’re thinking of a strategy’s total standard deviation and the fact that volatility can refer to both upside and downside performance movements.
Option 2: They’re thinking of a strategy that has a lower chance of generating negative returns.
We think there’s good reason to believe the mental translation investors make is the second option.
No Strategy Is without Weaknesses
Every investment strategy has a different balance of pros and cons, and the art of building a portfolio is in matching the two with the needs of different individual investors. It’s not a simple task.
Even if people think low-volatility exposures are a way to achieve defensive equity positions, it is not enough to think that because the name includes the words “minimum volatility” or “low volatility” that the work is done. It’s important to look under the hood of any strategy to determine what risks may or may not be evident.
Many Minimum Volatility Strategies Do Not Consider Valuation
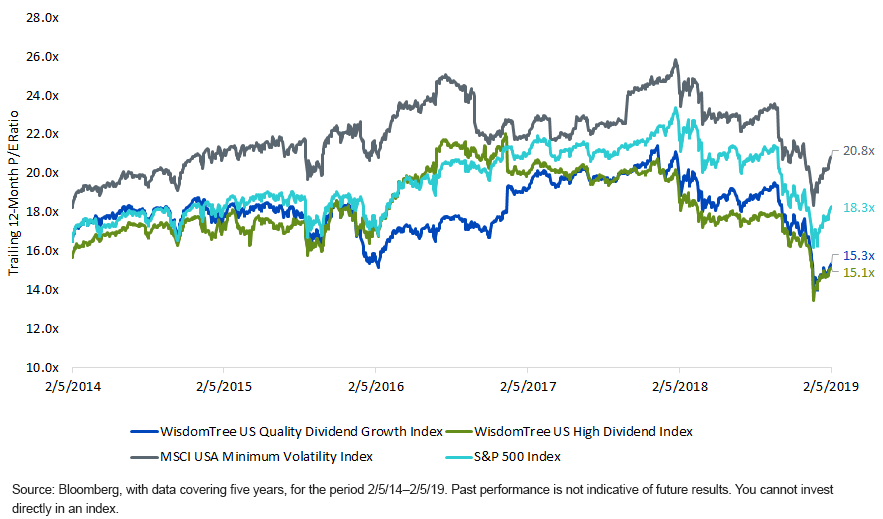
In figure 1, we see that for the MSCI USA Minimum Volatility Index:
- Over the five years ended February 5, 2019, the trailing P/E ratio was always higher than the S&P 500 Index. This peaked around the time of the near-term low in the U.S. 10-Year Treasury interest rate, which occurred July 8, 2016, at around a 25% premium, meaning the P/E of the low-volatility stocks was 25% higher than the market.
- Over the same period, the maximum valuation discount of both the WisdomTree U.S. Quality Dividend Growth Index and the WisdomTree U.S. High Dividend Index versus the S&P 500 Index was approximately 16% to 18%. As of February 5, 2019, this is precisely where we find ourselves—very close to this level of the maximum observed P/E ratio discount over the past five years.
Maybe you’re reading this and saying, “so what?” If the low-volatility stocks go down less, then they should be more expensive. They’ve probably outperformed, and that is why their P/E ratio is this much higher.
Let’s test that thinking.
Figure 1: Minimum Volatility Stocks Are Expensive in February 2019

Balancing Upside and Downside Equity Moves with the WisdomTree Quality Dividend Approach
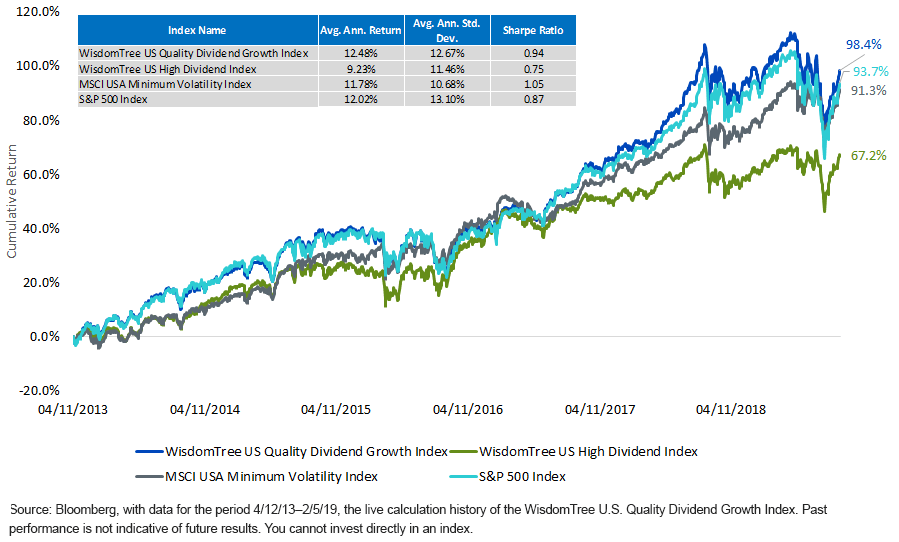
The WisdomTree U.S. Quality Dividend Growth Index began live calculation on April 12, 2013. There was a massive U.S. equity rally out of the gate, followed by the high volatility that we saw enter the scene in 2018. Figure 2 shows us the following:
- The WisdomTree U.S. Quality Dividend Growth Index outperformed the other three indexes over this period, which includes both upside and downside volatility. Stocks (such as Facebook, Amazon, Netflix and Google) that do not pay regular dividends are excluded.
- It is remarkable how much of a headwind the WisdomTree U.S. High Dividend Index faced over this period. This is one of the most “anti-momentum” strategies that WisdomTree has developed, and momentum was a factor driving the markets during much of the upward trends during this period.
- The MSCI USA Minimum Volatility Index delivered market-like performance over this period of nearly six years. Yes, risk was lower, but performance does not explain the reason why the approach should have such a premium multiple over the market.
Figure 2: WisdomTree U.S. Quality Dividend Growth Index Live History Compared with the MSCI USA Minimum Volatility Index

Maybe WisdomTree Is Unique and the Period Is “Too Short”
Let’s take the concepts of “higher quality,” “high dividend yield” and “low volatility” and look at a much longer period.
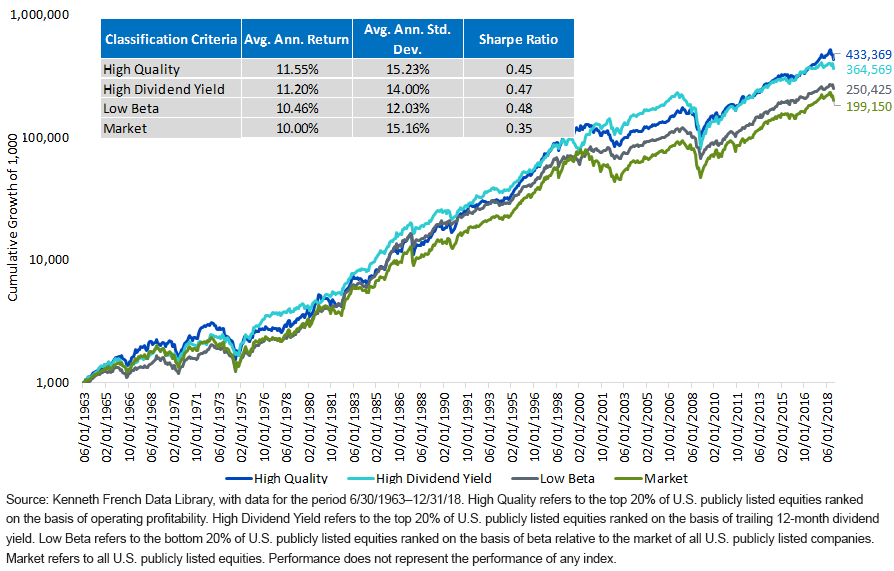
The Kenneth French Data Library is a publicly available source allowing us to go back to 1963 and test these concepts on an average annual return, average annual standard deviation and Sharpe ratio basis. Figure 3 indicates the following:
- The group of “High Quality” stocks sorted annually outperformed the other groups over this period. The average annual standard deviation of these stocks was very similar to that of the market, leading to a higher Sharpe ratio than the market, which is similar to what we saw with the WisdomTree U.S. Quality Dividend Growth Index in figure 2.
- The “High Dividend Yield” and “Low Beta” groups did better than the “High Quality” stocks at lowering risk. However, the range of Sharpe ratios was from 0.45 to 0.48. Yes, the “High Quality” stocks had the lowest end of the range, but is a 0.03 difference something that would have been noticeable during a period of almost 60 years?
Figure 3: How Does the Longer-Term Data Compare with the More Recent Period?

Conclusion: Quality Looks Attractive Now and Has Held Up Over the Long Term
If investors are looking to reinitiate or add exposure to U.S. equities at present, we think that a quality approach, such as the WisdomTree U.S. Quality Dividend Growth Index, could lead to a better valuation opportunity than the more defensively oriented MSCI USA Minimum Volatility Index.
In fact, if people believe the market is headed for a sharp correction, we’d think the WisdomTree U.S. High Dividend Index could be similarly defensively positioned without the valuation risk inherent to the low-volatility grouping.

Christopher Gannatti began at WisdomTree as a Research Analyst in December 2010, working directly with Jeremy Schwartz, CFA®, Director of Research. In January of 2014, he was promoted to Associate Director of Research where he was responsible to lead different groups of analysts and strategists within the broader Research team at WisdomTree. In February of 2018, Christopher was promoted to Head of Research, Europe, where he was based out of WisdomTree’s London office and was responsible for the full WisdomTree research effort within the European market, as well as supporting the UCITs platform globally. In November 2021, Christopher was promoted to Global Head of Research, now responsible for numerous communications on investment strategy globally, particularly in the thematic equity space. Christopher came to WisdomTree from Lord Abbett, where he worked for four and a half years as a Regional Consultant. He received his MBA in Quantitative Finance, Accounting, and Economics from NYU’s Stern School of Business in 2010, and he received his bachelor’s degree from Colgate University in Economics in 2006. Christopher is a holder of the Chartered Financial Analyst Designation.

