Small Caps as Responsible Repurchasers


Research reports on share buybacks (and popular hit jobs in the press) tend to focus on the large-cap segment of the market, but the small-cap story is just as important.
In a recent post, we showed that although buybacks generate much controversy as a form of cash distributions to shareholders, they have unquestionably added value. Over the last decade, shareholder yield as a valuation indicator has outperformed the traditional value sorts of the market (like the price-to-book ratio), which have had very poor returns.
For the S&P 500, adding buybacks to dividend yield alone added almost 200 basis points (bps) of performance per year to the highest-yielding quintiles of stocks.
Is the excess return from buybacks only a large-cap phenomenon? We applied the same value factor attribution we used for the S&P 500 to two small cap indexes, the S&P 600 and Russell 2000.
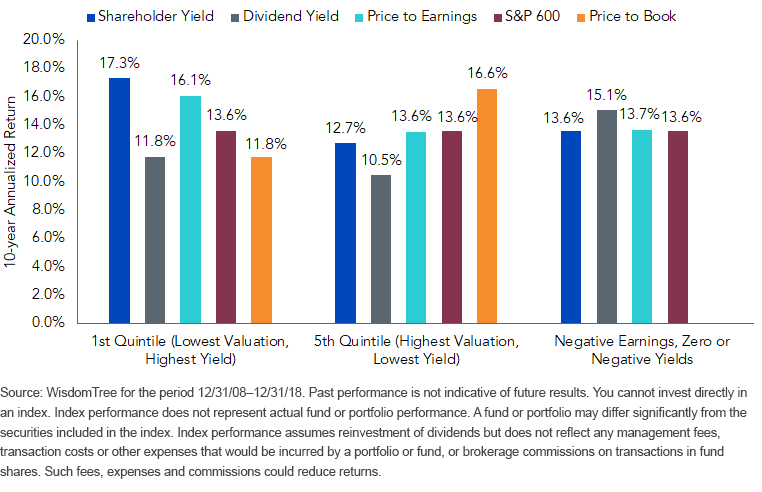
Attribution of S&P 600 Returns by Valuation Factor: 10 Years Ending 12/31/18

- For the S&P 600 Index, the top shareholder-yield quintile generated the strongest absolute level of return over the last decade (17.3%). This quintile had the #1 ranking return out of a total of 24 different splices of the S&P 600 based on price-to-earnings (P/E), P/B and dividend yield.
- Shareholder yield also delivered the strongest relative level of annual return in the last 10 years when compared with other measures of value. The least expensive shareholder yield quintile generated the largest excess return versus the most expensive quintile (+460 bps/year) and the benchmark (+373 bps/year).
- If we compare returns for the top quintiles of shareholder and dividend yield, we find that adding buybacks to dividend yield alone as a value factor increased returns by over 500 bps/year over the trailing 10 years (from 11.77% to 17.3%).
- This was also a strong decade for stocks that don’t pay dividends; they outperformed the highest quintile of dividend-yielding stocks by over 300 bps/year.
- P/E was also a good valuation factor for the S&P 600 on a relative and absolute basis. The annual return for the lowest P/E ratio quintile (16.1%) outpaced both the highest P/E ratio quintile and the benchmark by ~250 bps/year for the last 10 years.
- P/B was a broken value indicator—the most expensive P/B quintile outperformed the least expensive quintile and the benchmark by 481 bps/year and 296 bps/year, respectively, in the last 10 years.
The starting universe of stocks really matters for small caps. Applying the same factor attribution to the Russell 2000, we find that overall index returns drop ~160 bps from 13.6% per year for the S&P 600 to 12.0% for the Russell 2000. This is a fairly dramatic drop for two market cap-weighted beta benchmarks for small caps.
Clearly, not all benchmarks are the same.
The biggest difference between Russell and S&P is driven by the S&P family of indexes including a profitability factor: firms have to be profitable to enter S&P indexes, while the Russell 2000 typically has 20% of its weight in speculative, unprofitable companies. This quality bias has served the S&P 600 well.
The S&P 600 profitability screen also magnified the gains for the top quintile of stocks by valuation factors.
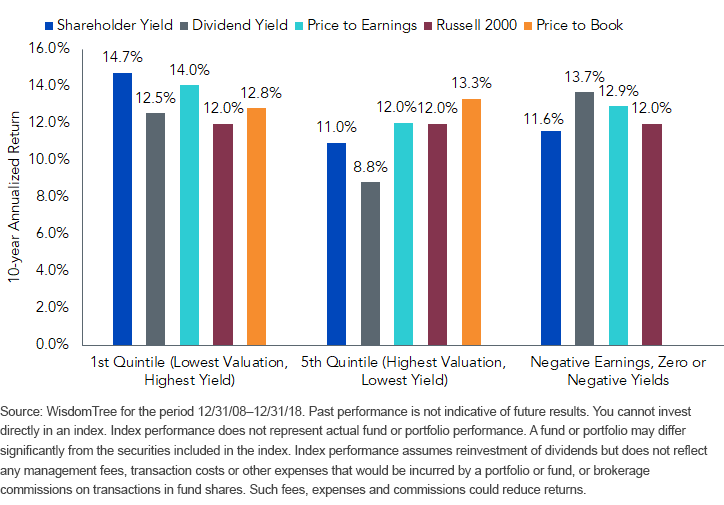
Attribution of Russell 2000 Returns by Valuation Factor: 10 Years ending 12/31/18

- For the Russell 2000, the top shareholder yield quintile generated the strongest absolute (14.7%) and relative levels of annual return over the last decade. This is no different from what we saw in the S&P 600. Consistent with the outperformance of the S&P 600 versus the Russell 2000, the top quintile of shareholder yield in the Russell 2000 lagged that of the S&P 600 by ~260 bps/year.
- Among Russell 2000 companies, buybacks added over 200 bps/year compared with dividend yield alone as a valuation factor for the highest quintiles of stocks.
- The P/E ratio was also a very good valuation indicator for the Russell 2000. The annual return for the lowest P/E ratio quintile (14.0%) outpaced both the highest P/E ratio quintile and the benchmark by ~200 bps/year.
- P/B was less of a broken value indicator for the Russell 2000 than for the S&P 600 in the trailing 10 years. The most expensive quintile of P/B ratio stocks in the Russell 2000 outperformed the least expensive quintile and the benchmark by 50 bps and 133 bps, respectively.
- The highest dividend-yielding stocks in the Russell 2000 outperformed the lowest yielders by 374 bps/year. But they lagged the zero-dividend payers by ~115 bps annually over the last 10 years. Outperformance by non-dividend payers aptly explains the strong returns experienced by growth-oriented companies in the last decade.
Takeaways
High shareholder yield is a compelling investment criterion for both the small- and large-cap segments of the market.
Notably, attribution analysis of the S&P 600 versus the Russell 2000 by value factor demonstrates that basic quality screens, like those employed by the S&P index family, can improve traditional valuation sorts of the market, as seen by the return differential between the top shareholder yield quintiles of each index.
When we created the WisdomTree U.S. Quality Shareholder Yield Fund (QSY), we combined quality metrics with valuation criteria to help increase the overall efficacy of the value approach. Importantly, the universe from which we select QSY is not confined to large-cap stocks because shareholder yield has proven to be a strong measure of value in small caps—even more so than in large caps!
The combination of WisdomTree’s proprietary quality factor and strong value factor built into QSY is a potent mix.
Important Risks Related to this Article
There are risks associated with investing, including possible loss of principal. Funds focusing their investments on certain sectors increase their vulnerability to any single economic or regulatory development. This may result in greater share price volatility. While the Fund is actively managed, the Fund’s investment process is expected to be heavily dependent on quantitative models and the models may not perform as intended. Please read the Fund’s prospectus for specific details regarding the Fund’s risk profile.

Jeremy Schwartz has served as our Global Chief Investment Officer since November 2021 and leads WisdomTree’s investment strategy team in the construction of WisdomTree’s equity Indexes, quantitative active strategies and multi-asset Model Portfolios. Jeremy joined WisdomTree in May 2005 as a Senior Analyst, adding Deputy Director of Research to his responsibilities in February 2007. He served as Director of Research from October 2008 to October 2018 and as Global Head of Research from November 2018 to November 2021. Before joining WisdomTree, he was a head research assistant for Professor Jeremy Siegel and, in 2022, became his co-author on the sixth edition of the book Stocks for the Long Run. Jeremy is also co-author of the Financial Analysts Journal paper “What Happened to the Original Stocks in the S&P 500?” He received his B.S. in economics from The Wharton School of the University of Pennsylvania and hosts the Wharton Business Radio program Behind the Markets on SiriusXM 132. Jeremy is a member of the CFA Society of Philadelphia.

