
Tracking HY Defaults in 2018: What’s in Your Index?


Amid the recent sell-off in risky assets, many investors are wondering if this is a momentary blip or the beginning of a more protracted slowdown. While some seem content to hold (or even add to) equity risk, we’ve fielded a number of questions about the overall health of the high-yield market. In this piece, we’ll examine the highest-profile defaults of 2018 and provide some rationale for why a fundamental approach1 to high yield can potentially avoid the pitfalls inherent in market cap weighting.
High Yield in 2018
Year-to-date, U.S. corporate high yield is one of the strongest performing sectors in global fixed income. This is primarily a function of a robust U.S. economy, strong corporate earnings and below-average default rates. However, as the current expansion enters its 10th year, we believe investors should not lose sight of some of the cracks beginning to form in U.S. credit. By our count, 19 issuers in the U.S. high-yield corporate bond universe2 have defaulted so far this year, with the most recent being Sears filing for Chapter 11 on October 15. While that’s not an alarming number historically, investors should consider whether they expect corporate defaults to become more common in the months and years ahead.
The co-founder of Oaktree Capital Management, Howard Marks, tells us, “We may never know where we’re going, but we’d better have a good idea where we are…..and act accordingly.” The consensus view is that we are later in the credit cycle, rather than the middle. Coming off a period of historically low rates, corporate balance sheets are modestly leveraged and volatility is creeping its way back into markets. In our view, investors are still being rewarded for maintaining exposure to high yield, but they should consider doing so via a fundamental approach. In our view, the WisdomTree Fundamental U.S. High Yield Corporate Bond Index can be particularly useful in the current environment.
Corporate Defaults
In 2018, of the 19 companies (issuers) that have defaulted, the market cap weighted index held 16 of them accounting for 31 bonds (issues) in total. These companies make up approximately 1.19% of the overall investable universe. This compares to a single issue and a single issuer in our fundamentally based approach constituting only 0.21% of the index. In the chart below, we summarize the batting average between our fundamental approach and the market.
Default Scorecard for 2018
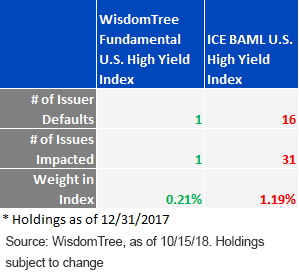
Put another way, the market cap Index had roughly 5.7x more bonds defaulting (based on par value) compared to our fundamental Index in a comparatively benign credit environment. When defaults occur, indexes can experience considerable drawdowns as bond prices plummet. While a bond’s value need not go to zero in the event of a bankruptcy, Moody’s trailing 12-month global defaulted bond recovery rates on subordinated debt are roughly 42 cents on the dollar.3 In the case of Sears’4 6.625% 10/15/18 issue, this bond was priced at $89 on October 1. As of this writing and following the Chapter 11 filing, the bond has fallen to approximately $22. While we won’t know the ultimate recovery value for Sears’ debt for several more months (or years), the WisdomTree Fundamental U.S. High Yield Corporate Bond Index has outperformed the market by 60 basis points (bps) year-to-date and 91 bps over the previous year. In the next section, we identify the factors that excluded these bonds.
Examining Our Process
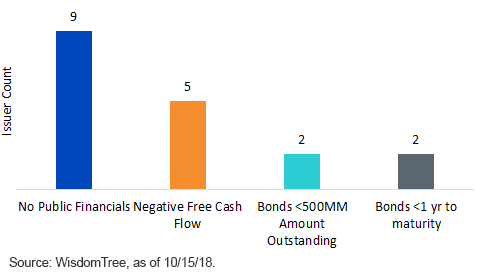
The WisdomTree Index uses a combination of factors to identify bonds with favorable risk/reward in high yield. Step one of the process is to exclude issuers that do not have publicly traded equities and thus may not report public financials. In our view, these companies are under less scrutiny to manage a healthy balance sheet. This approach has helped our Index avoid nine defaults so far this year.
Additionally, the Index also screens out bonds with negative free cash flow, an indicator of poor balance sheet quality and a higher likelihood of future distress. Companies with negative free cash flow have limited options to pay down their debt. Options include borrowing more money, selling assets and defaulting on their interest/principal payments. None of these options are good for credit investors. By focusing on free cash flow, our Index avoided five defaults.
Finally, we also exclude bonds issued in sizes of less than $500 million and with less than one year to maturity. While issuance size may not necessarily be a harbinger of a company’s credit-worthiness, there is a positive correlation between the size of a bond offering and that company’s track record of borrowing responsibly. Finally, for speculative borrowers, rollover risk increases dramatically as bonds approach maturity. In our view, excluding companies that fall into this potentially dangerous window is another way investors can manage risk. These steps helped the Index avoid four additional defaults.
Reason Issuers That Defaulted in 2018 Were Excluded from WT Fundamental U.S. High Yield Index
Digging deeper, we also examine the individual companies that filed for bankruptcy in 2018. In the table below, you can see that this year’s defaults came from a wide range of industries. By focusing on a variety of fundamentals, the WisdomTree approach was able to avoid the potentially problematic credits.
2018 Default Monitor: 1/1/2018 through 10/16/2018
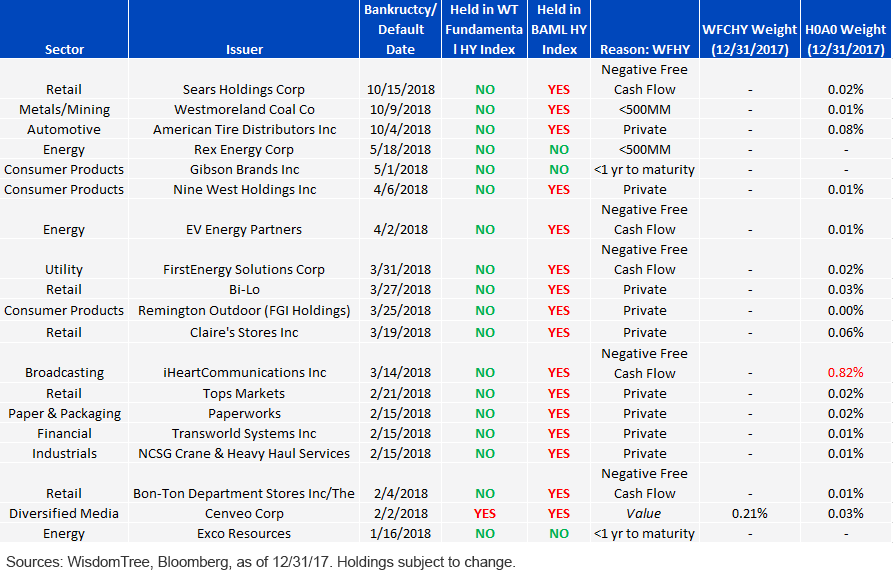
While there is no guarantee that our approach will identify problems in credit before they occur, market cap weighted approaches provide no such protection. In our view, 18 for 19 is good shooting percentage for the Fundamental High Yield Index.
1As measured by the WisdomTree Fundamental U.S. High Yield Index (WFCHY)
2As measured by the ICE BAML U.S. High Yield Index (H0A0)
3Source: Moody’s, as of 9/30/18.
4For holding of Sears in our WisdomTree Fundamental U.S. High Yield Index, please click here.
Share & Comment
Popular Posts
Categories
Related Links