
U.S. Econ Watch: Expanding Your Horizons


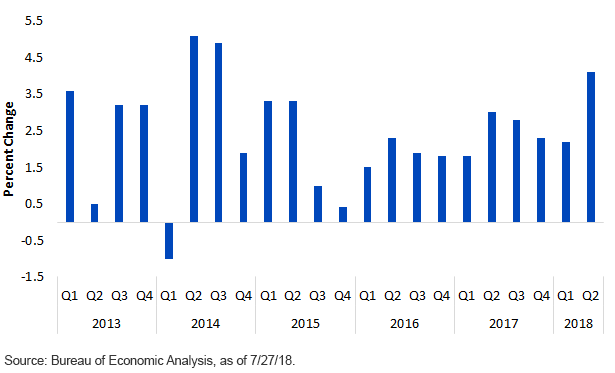
The increase in the pace of U.S. economic growth in the second quarter generated quite a bit of headlines since the Bureau of Economic Analysis (BEA) released the data last Friday. For the record, BEA reported that the real gross domestic product (GDP) for the second quarter of 2018 expanded by an annual rate of +4.1%, representing not only a visible improvement from the first-quarter pace of +2.2%, but it was also the best performance since 2014. Needless to say, the April to June result has produced a debate over whether this pace of growth is sustainable.
To understand this discussion, one must look beyond the headline growth figure and instead focus on the underlying components. In other words, what are the “cylinders” of the real GDP engine, and how did they perform in the second quarter? There are basically five cylinders to consider: personal consumption expenditures (PCE), gross private domestic investment, change in private inventories, net exports of goods and services, and government spending and investment. Let’s take a quick look at each one and see if we can gain any useful insights for the future.
U.S. Real GDP
Personal Consumption Expenditures: PCE is perhaps the most noteworthy component for overall growth. In the second quarter, the annual growth rate for PCE came in at +4.0%, which contributed roughly 2.7% to the real GDP increase. Perhaps more importantly for upcoming trends, the BEA posted a notable upward revision to the savings rate for 2017. To provide perspective, the savings rate now stands at 6.7%, or almost double the prior reading of 3.4%. This increase combined with some of the positive impacts from the recent Tax Cuts and Jobs Act could provide a nice glide path for future consumer spending trends.
Gross Private Domestic Investment: This category consists of both residential and nonresidential investment. Nonresidential, or business, investment surprised to the upside, rising +7.3% in the period, and was not nearly offset by the -1.1% drop in the residential grouping. While higher mortgage rates could possibly dampen housing activity, corporate tax and regulatory relief should be viewed as potential tailwinds in the quarters ahead.
Change in Private Inventories: This cylinder can act as a wild card in any given quarter, specifically because in the advanced GDP report, the BEA does not have full data but makes estimates instead. For the second quarter, inventories subtracted -1.0% from growth. This could bode well for the third quarter, at a minimum, because declines in this category often get reversed in subsequent quarters.
Net Exports of Goods and Services: Another one of the wild-card categories. Once again, full data for the quarter has not yet been reported, and BEA needs to fill in the blanks. Net exports actually contributed +1.06% to second-quarter growth, led by a robust +9.3% gain for exports. This cylinder certainly could become a wild card in a whole different meaning looking ahead given the uncertainties surrounding trade in general and could enter more as a headwind to overall conditions.
Government Spending and Investment: Rounding out our list is the grouping that includes federal as well as state and local figures. Both areas came in on the plus side of the ledger in the second quarter, registering a combined gain of +2.1%. The federal level posted the more robust gain, led by a +5.5% increase in defense spending. Given the increase of over $1.0 trillion that was included in the fiscal year 2018 omnibus spending bill, future support from the federal government category would appear more than likely, coming in the areas of both defense and domestic discretionary spending.
Conclusion
Given the aforementioned cylinders, it seems plausible to expect an improved economic performance compared with the 2017 rate of +2.2%. In fact, consensus forecasts look for real GDP to register a gain of +2.9% for 2018. While the second quarter’s +4.1% growth rate may not necessarily be duplicated on a regular basis, perhaps the average growth rate for the first half of this year is a more reasonable expectation. For the record, the rate for the first half of 2018 figure is +3.2%, not too far removed from consensus estimates. Obviously, this all assumes no further escalation in the “trade war.” Stay tuned…
Unless otherwise stated, all data is from Bloomberg as of July 27, 2018.
Share & Comment
Popular Posts
Categories
Related Links