
What Makes This Fund One of the Best-Performing U.S. Multifactor Strategies?


The 10 largest multifactor exchange-traded funds (ETFs) in the market hold over $10 billion in assets and saw $1.7 billion of net inflows over the last year.1 In the beginning of that time frame—specifically, June 29, 2017—WisdomTree entered into the fray, launching the WisdomTree U.S. Multifactor Fund (USMF). We are pleased to announce that after one year of live performance, USMF outperformed all 10 of these multifactor ETFs on both an absolute and risk-adjusted basis. In fact, of these 10 ETFs, USMF exhibited the third lowest volatility, with the two lower-volatility ETFs achieving their risk reduction at the cost of being the worst two in performance.
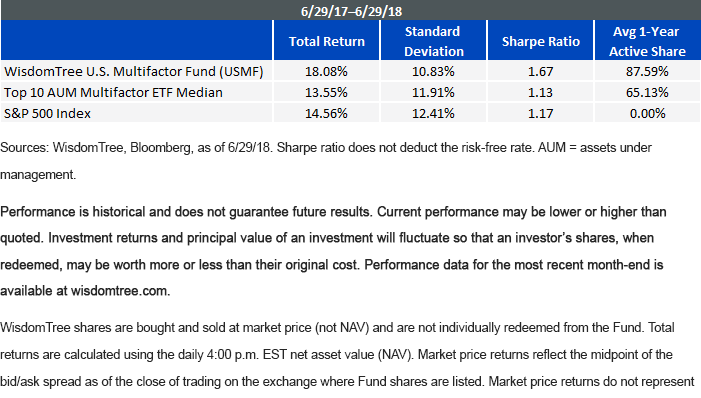
In the table below, we highlight median statistics, showcasing just how dominant USMF’s first year has been.
For standardized performance of USMF, please click here.
We added active share to the table above because we believe it’s an important aspect of USMF. At its core, our multifactor strategy is a stock-picking strategy, informed by the factors value, quality, momentum and low correlation. Given that our conviction in our factor-based stock selection model is high, we view more active share as increasing the chance for better fundamentals, superior returns and less volatility than the market. This is also one reason why we incorporate sector neutrality and the low-correlation factor, to help mitigate sector and market risk and to magnify the effects of our high-conviction stock picking.
Multifactor Transparency: How Does USMF Select Stocks?
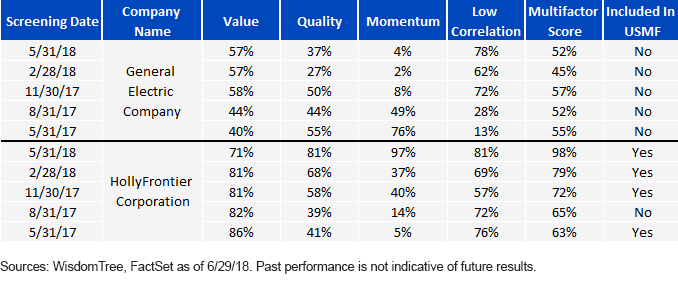
We often hear that multifactor ETFs are too complicated and nontransparent. So, in the spirit of our one-year anniversary, we wanted to walk through our two biggest single stock winners, both from an exclusion and inclusion standpoint. The table below shows a breakdown of our scoring system, with 100% being the best possible score and 0% being the worst. We perform these calculations on all 800 stocks in our universe, and then select the top 200 stocks with the best aggregate multifactor score. Learn more about the strategy underlying each factor score.
Please click here for the holdings of General Electric Company and Holly Frontier Compotation in USMF.
- General Electric: As many know, GE has experienced a terrible plunge over the last year, dropping around 50% in value, with an average weight in the S&P 500 over that time frame of .73%. From excluding this single stock, USMF has added roughly 72 basis points (bps) of outperformance versus the S&P 500 over the last year. We can see at our first screening on May 31, 2017, that GE’s momentum score was decent at 76%, but mediocre value and quality scores, along with a low score for low correlation, kept it from inclusion. Since then, its momentum score has fallen dramatically along with quality, while its low correlation and value scores have generally risen, resulting in a somewhat consistent, subpar multifactor score.
- HollyFrontier Corporation: This less-known energy company had an average weight of .56% in USMF over the last year while being absent entirely from the S&P 500. It has consistently raised its multifactor score during every screening since USMF has been live, and over the last year, it has added roughly 56 bps to USMF’s relative outperformance versus the S&P 500. While some of its value score has been lost over time, moving from 86% on May 31, 2017, to 71% on May 31, 2018, we have seen its quality score double, its momentum score go from 5% to 97% and its low correlation score rise to its high at 81%. Indeed, this stock’s multifactor score is now at 98%, making it a leader of the pack. In many ways, this stock has been every investor’s dream, riding a deep value stock as it becomes a momentum stock. Interestingly, right around the time of 2018 stock market volatility is where we see momentum and low correlation begin to rise, as the market was down more than 7.5%, and HollyFrontier continued its consistent gains, posting a positive .85% return and showing resilience in today’s market environment.2
Conclusion
USMF’s biggest losers due to stock selection were no surprise to us. Big-name companies such as Amazon, Microsoft and Netflix tend to have high correlations to the market and unfavorable valuations, which means their risk-adjusted momentum and quality metrics would have to be among the best in our universe to be included. However, USMF has shown over the past year that allocating more money to a company simply because it’s larger doesn’t have to be the status quo. In fact, at a time when those companies generally have been outperforming, USMF has still beat the market by over 3.5%, as well as the majority of other multifactor ETFs beyond just the top 10, as measured by assets under management.
1Bloomberg, as of 6/29/18.
2Bloomberg; period referred to is 1/26/18–3/29/18.
Important Risks Related to this Article
There are risks associated with investing, including possible loss of principal. Investing in a Fund exposed to particular sectors increases the vulnerability to any single economic, political or regulatory development. This may result in greater share price volatility. Due to the investment strategy of the Fund, it may make higher capital gain distributions than other ETFs. Please read the Fund’s prospectus for specific details regarding the Fund’s risk profile.