WisdomTree U.S. Multifactor Index: A Year in Review


At WisdomTree’s core is the belief that it may be possible to generate greater excess return over time by taking on greater active risk and concentrating index holdings in stocks that have greater exposure to the factors that historically have been associated with excess return. We designed the WisdomTree U.S. Multifactor Index (WTUSMF) to target factors consistent with many “smart beta” approaches. But we believe our method of combining factors to maximize the potential for higher absolute and risk-adjusted returns is unique. The Index now has more than a year of live performance, and we are pleased with the results.
Attractive Performance Results
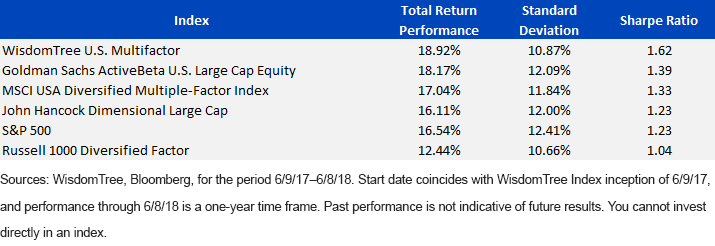
Over the past year, WTUSMF was able to outperform other indexes with similar objectives on both an absolute return and risk-adjusted return basis. It is also interesting to note that the Index showed 238 basis points (bps) of outperformance against the S&P 500 Index, the barometer for U.S. equity markets, while also exhibiting less risk—increasingly important given the rise in volatility this year.
One-Year Performance

WisdomTree U.S. Multifactor Index
WisdomTree blends both fundamental and technical factors to create a composite factor score for the purposes of stock selection. The composite score is an average of four factors, with value and quality being driven by fundamentals, while momentum and correlation are driven by technical factors or price. Because each factor has an equal weight, all of them are pushing or pulling the composite factor score with some force. During a market environment where you see increased volatility, correlations and return dispersions, you might expect the technical factors to generate more force through larger changes in relative rank.
At the most recent quarterly rebalance, the largest change in scores for the drops were correlation, representing almost 50% of the total drops, and momentum, representing a little over 30%. The largest changes in scores for the additions were momentum (50%) and correlation (31%). Now, just because we didn’t see a large change in individual fundamental scores doesn’t mean the Index fundamentals remain the same. The shifts, driven by the technical factors, also influenced the composition and fundamentals of the Index.
The Index has a sector-neutral constraint, so there weren’t large differences in the sectors, but there were some minor adjustments based on price changes since the last rebalance. The most notable changes to the basket are highlighted in the table below.
Comparison of Fundamentals

- Reinforced Exposure toward Mid-Cap Segment: During the last quarterly rebalance, it was noticeable that the Index rebalanced into more mid-cap exposure, adding approximately 15%. This recent rebalance saw continued confirmation with a small increase to mid-cap equities. This is important to note because since the last rebalance we have seen strong relative strength from the smaller capitalization segment. One common discussion about the equal-weighted S&P 500 is its mid-cap drift, and that can be seen in its weighted average market cap being $48 billion compared with the S&P 500’s $203 billion. The WisdomTree U.S. Multifactor Index has a weighted average market cap half that of the equal-weighted S&P 500, showcasing even more of a size tilt away from pure mega caps.
- Lower Interest Rate Sensitivity Continued: We continue to witness increased volatility and poor performance from some of the “traditional” lower-volatility and high-dividend-yield securities. The risk-adjusted momentum score would work to potentially keep these types of securities from achieving a high composite rank. At the last rebalance, the aggregate Index dividend yield fell by 33 bps, and the preference to remain in lower-dividend-yielding equities continued with this rebalance. The weighted average market cap and leverage of the Index remain below the S&P 500 Index; both support potentially lower interest rate sensitivity.
- Stepping Up the Quality: Because quality is one of the factors, it’s no surprise to us that there was a slight increase in the return-on-equity and return-on-assets measurements. The quality score looks at companies that display strong quality metrics currently but also exhibit an improvement in the metrics. Typically, you would expect to “pay up” for this type of quality basket, so it is encouraging to see the Index trade at a lower price-to-earnings (P/E) multiple than the S&P 500 Index. On a trailing earnings basis, the Index is priced more than 25% lower than both the S&P 500 Index and S&P 500 Equal Weight Index, which should attract interest from those concerned about rising multiples in the U.S.
The WisdomTree U.S. Multifactor Index has been a relatively strong performing U.S. equity index in 2018, and the rebalance process we just completed is a critical driver of its long-term addition to value. In follow-up posts, we will continue to showcase how the deep factor tilts of this process contrasts with many other multifactor indexes that involve much lower-grade tilts on the market. In our view, when designing a multifactor process that competes with a true alpha-seeking manager, one should lean into active share like this multi-factor index does.


