What Drives Emerging Market Small-Cap Performance?


WisdomTree recently rolled out a new performance attribution tool to help our clients understand drivers of the equity market performance, both for our Indexes as well as the market. We have pushed the attribution envelope beyond just standard breakdowns such as by sector, country or market cap into fundamental factors. As we continue to expand our library of attribution data, there are many insights that can be gleaned from this tool. Today, we highlight emerging market small-cap performance attribution.
Do You Need an Active Manager for Inefficient Markets?
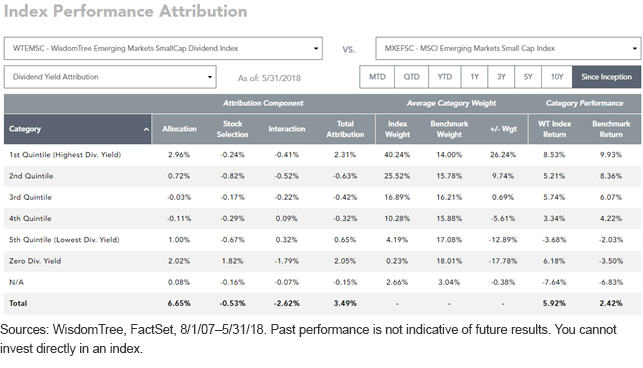
One common belief is that emerging markets are “inefficient,” particularly, small caps, so one must use an active manager for this segment. WisdomTree challenges that notion, and some of our best relative performance has come in this inefficient market segment. Since inception, the WisdomTree Emerging Markets SmallCap Dividend Index has outperformed its cap-weighted benchmarks by 349 basis points (bps) per year. This strategy weights by dividends and tilts weight to higher-dividend-yielding stocks.
One can see just how big the tilts are using a dividend yield quintile attribution. This attribution starts by creating dividend-yielding portfolios from the market cap index (five quintiles, separate from two buckets of zero-dividend payers and a category for when there is no data). We then look at the weight of each index in these dividend-yield portfolios and their performance. As you can see in the tool below, as of May 31, 2018:
- The WisdomTree dividend-weighted strategy had 40.24% allocated to the top-dividend-yield quintile versus just 14.0% for the market cap-weighted index, a big differential. This higher allocation was a large driver of performance (231 basis points of the 349 basis points of total outperformance).
- The second-biggest driver of performance was the under-weight to the non-dividend-paying segment of emerging markets small-cap indexes—these stocks declined over the since-inception time period—underperforming the broad market by nearly 600 bps per year for more than a decade and the WisdomTree Index by nearly 950 bps per year over this since-inception period. The cap-weighted index had a significant amount of weight allocated to this non-dividend-paying segment (approximately 20% of the index), while the WisdomTree Index, by definition, includes only dividend-paying stocks at its rebalance.

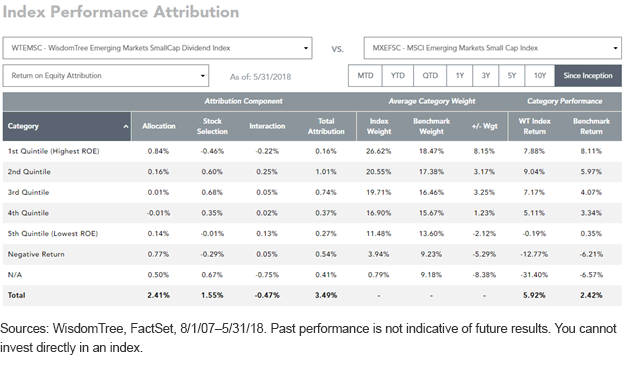
The over-weights in the top dividend-yielding stocks is one way this index introduces a “value” discipline and helps provide the index with higher-dividend yields and improvements on other valuation criteria. Yet value is only one of the factors screening by dividends provides exposure to. We also often say dividend weighting enhances the quality of the basket. One way to see this impact is through attribution on return on equity (ROE) (profitability) metrics and quintiles.
- The cap-weighted MSCI Emerging Markets Small Cap Index has a greater weight to unprofitable companies and that can be found with 9.23% allocated to negative earnings and another 9.18% in a category with no data—this no data is likely because the companies were unprofitable—showing about 20% of the index in unprofitable stocks (similar to why these companies are not paying dividends above). These stocks dramatically underperformed the market with both the N/A and negative earnings underperforming the broader market by more than 800 bps per year for over a decade. WisdomTree had much less exposure to these segments.
- By contrast, the biggest over-weights in the WisdomTree Emerging Markets SmallCap Dividend Index were to the higher-ROE quintiles.

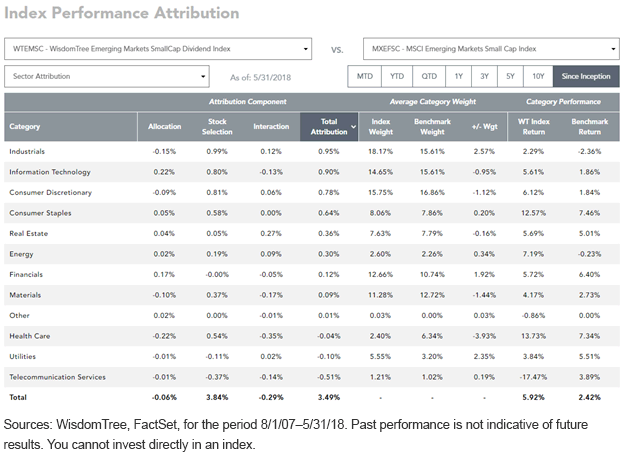
Another reason why it may make sense to invest in emerging market small caps is the different country and sector mix one can get in these companies. The sector exposure tends to be more Industrials, Consumer, Tech and Financials and less commodity-heavy sector exposure. This has resulted in small caps having less risk than large caps over the last decade. One can see just how exposed the index is to countries and sectors in this report.

This new attribution feature has a lot of great insights at what factors drove both WisdomTree Index returns as well as cap-weighted benchmark returns. If you want to see quick drivers across time periods and indexes—U.S., developed world, emerging markets and factors including sectors, dividend yield, price/earnings ratio and profitability benchmarks—this tool can help you understand the market in new ways. Access the Index Performance Attribution here.
All data as of May 31, 2018, and sourced from WisdomTree and FactSet.

Jeremy Schwartz has served as our Global Chief Investment Officer since November 2021 and leads WisdomTree’s investment strategy team in the construction of WisdomTree’s equity Indexes, quantitative active strategies and multi-asset Model Portfolios. Jeremy joined WisdomTree in May 2005 as a Senior Analyst, adding Deputy Director of Research to his responsibilities in February 2007. He served as Director of Research from October 2008 to October 2018 and as Global Head of Research from November 2018 to November 2021. Before joining WisdomTree, he was a head research assistant for Professor Jeremy Siegel and, in 2022, became his co-author on the sixth edition of the book Stocks for the Long Run. Jeremy is also co-author of the Financial Analysts Journal paper “What Happened to the Original Stocks in the S&P 500?” He received his B.S. in economics from The Wharton School of the University of Pennsylvania and hosts the Wharton Business Radio program Behind the Markets on SiriusXM 132. Jeremy is a member of the CFA Society of Philadelphia.

