Why Option-Selling Strategies Make Sense in 2018


2017 was a unique year in two respects. One, it was the ninth consecutive positive year for the S&P 500 (a bull run, which has happened only twice since the 1950s); and two, this bull run was accompanied by extraordinarily low volatility for equities. For most of 2017, the Chicago Board of Options Exchange (Cboe) Volatility Index (VIX), a measure of the market’s expectation for forward volatility, traded below 10. That is less than half its long-term average of 20. In the baseball world, this would have been like the Yankees winning all games in 2017 with no nail-bitters going down to the last innings. As much as I love the Yankees, it has rarely happened, in my memory at least!1
In quite a contrast, the first quarter of 2018 has been a true testament to many nail-biting performances. There were multiple such days, most interestingly February 5, when the VIX spiked by 20 basis points (bps) in a single day (an event with a historical likelihood of 0.002%. Just as a stressful inning can separate an average player from one who can handle pressure, days of market stress can separate ordinary strategies from ones that could be match winners for your portfolio.2
The WisdomTree CBOE S&P 500 PutWrite Strategy Fund (PUTW) and the WisdomTree CBOE Russell 2000 PutWrite Strategy Fund (RPUT) track Cboe’s PUT and PUTR, respectively, after fees and expenses. The underlying Indexes of the two strategies have an established track record of handling stress and being a potential match winner for investors seeking portfolio risk reduction. Let’s see how the two players performed in the last volatile season of Q1 2018.
Q1 2018: A Batting Average of 100% in Down Markets
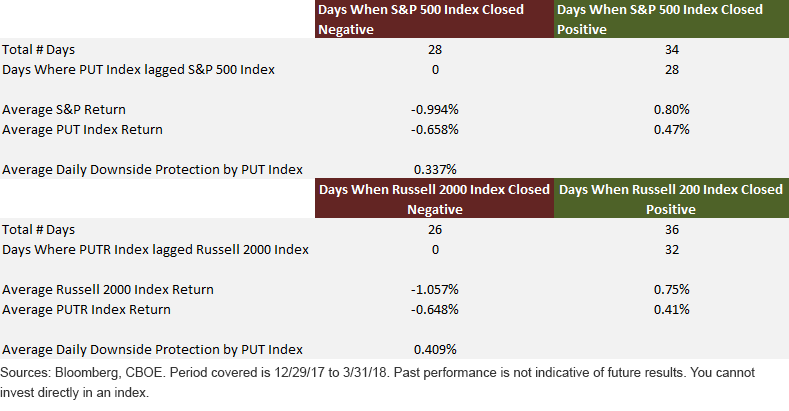
In Q1 2018, out of a total of 62 trading days, the S&P 500 had 28 negative trading days, while the Russell 2000 had 26. A true test of any VOLATILITY-reducing strategy lies in its relative performance on these negative days. Thus, we created a table comparing PUT and PUTR performance to their benchmarks on those down days.

Quick takeaways
- PUT outperformed the S&P 500 on every single negative day.
- Additionally, PUT on average delivered downside protection of ~33 bps on each one of those down days.3
- Similarly, PUTR outperformed the Russell 2000 on every single down day, and it did so with average downside protection of ~41 bps on each of those down days.4
Taking a Deeper Look
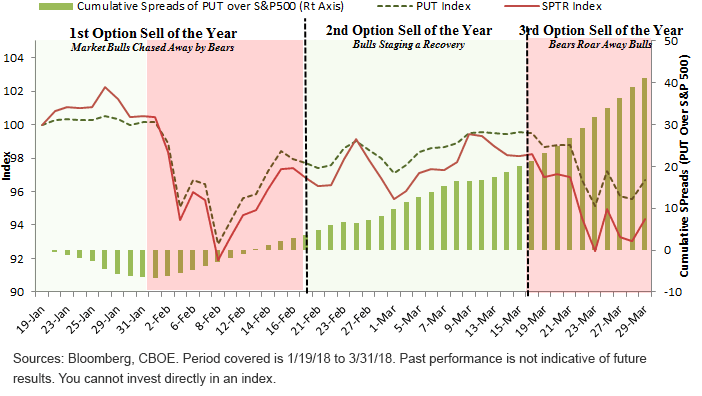
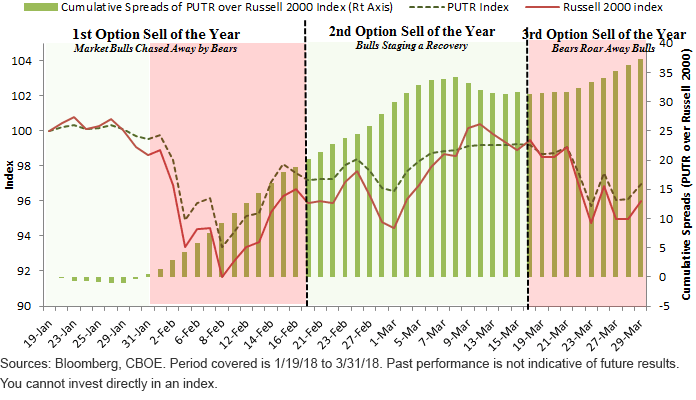
Let’s take our comparison a step further and delve into how the two strategies performed since they sold their first options for the year. As a refresher, both strategies collect premiums by selling an at-the-money European-style put options with monthly maturity, with PUT involving selling on the S&P 500 Index and PUTR involving selling on the Russell 2000 Index. Monthly options typically expire on the third Friday of every month, and therefore the first time both strategies rolled into a new position was January 19 (i.e., the third Friday of January 2018). Now, in mid-January markets were trending to new highs and volatility was still low. To be fair, both strategies, which typically benefit when volatility is high (by collecting higher option premiums), were still not at their full glory when they rolled into their first option sell for 2018. Exhibits below (top for PUT and bottom for PUTR) show the three phases of the market’s boom and bust for Q1 2018.
- Phase 1 (mid-January through mid-February): On January 19, both strategies roll their first options of the year.
- Phase 2 (mid-February through mid-March): On February 16, both strategies roll their second options for the year.
- Phase 3 (mid-March through the end of Q1 2018): On March 16, both strategies roll their third options for the year.5
Performance of PUT Index vs S&P 500 Index During Market Correction Early This Year

Performance of PUTR Index vs Russell 2000 Index During Market Correction Early This Year

In both instances, it is evident that:
- During Phase 1, initially both strategies lagged their respective benchmarks as markets reached new highs. However, their real benefit kicked in right when markets started correcting toward the end of January.
- During Phase 2, by rolling onto the second option of the year when VIX spiked (owing to a February 5 spike in volatility), both strategies collected richer premiums, which then helped their total return build up over respective benchmarks. Therefore, while markets were sideways, the two strategies delivered decent outperformance.
- Finally, in Phase 3, as both strategies sold their third options for the year, continued higher volatility ensured continued collection of higher premiums—in other words, a continued basis for outperformance.6
Conclusion
Warren Buffett once famously said, “You only find out who is swimming naked when the tide goes out.” I think similarly, the true colors of any risk-reduction strategy are not revealed on days when the market is up; rather, they are revealed on days when the market is down.
We believe incorporating PUTW and RPUT in large-cap and small-cap allocations is akin to incorporating a batter with a batting average of 100% from last season, which was an extremely volatile one!
1Sources: Bloomberg, CBOE.
2Sources: Bloomberg, CBOE.
3Sources: Bloomberg, CBOE. Period covered is 1/19/18 to 3/31/18.
4Sources: Bloomberg, CBOE. Period covered is 1/19/18 to 3/31/18.
5Sources: Bloomberg, CBOE. Period covered is 1/19/18 to 3/31/18.
6Sources: Bloomberg, CBOE. Period covered is 1/19/18 to 3/31/18.
Important Risks Related to this Article
Investors should not expect that such favorable returns can be consistently achieved. Performance, especially for very short periods, should not be the sole factor in making investment decisions.
There are risks associated with investing, including possible loss of principal. The Fund will invest in derivatives, including Russell 2000 Index put options (“RUT Puts”). The Fund will invest in derivatives, including S&P 500 Index put options (“SPX Puts”). Derivative investments can be volatile, and these investments may be less liquid than other securities, and more sensitive to the effects of varied economic conditions. The value of the RUT Puts in which the Fund invests is partly based on the volatility used by market participants to price such options (i.e., implied volatility). The value of the SPX Puts in which the Fund invests is partly based on the volatility used by market participants to price such options (i.e., implied volatility). The options values are partly based on the volatility used by dealers to price such options, so increases in the implied volatility of such options will cause the value of such options to increase, which will result in a corresponding increase in the liabilities of the Fund and a decrease in the Fund’s NAV. Options may be subject to volatile swings in price influenced by changes in the value of the underlying instrument. The potential return to the Fund is limited to the amount of option premiums it receives; however, the Fund can potentially lose up to the entire strike price of each option it sells. Due to the investment strategy of the Fund, it may make higher capital gain distributions than other ETFs. Please read each Fund’s prospectus for specific details regarding the Fund’s risk profile.


