U.S. Treasuries: Revisiting the Flattener


If you had asked market participants what their expectations were for the U.S. Treasury (UST) yield curve (the difference in yield between the UST 10-Year and UST 2-Year notes) heading into 2018, 9 out of 10 would probably have said they expected the construct to continue to flatten. Well, how has this prognostication fared? The answer is rather surprising, so let’s take a look at how things shaped up as Q1 came to a close.
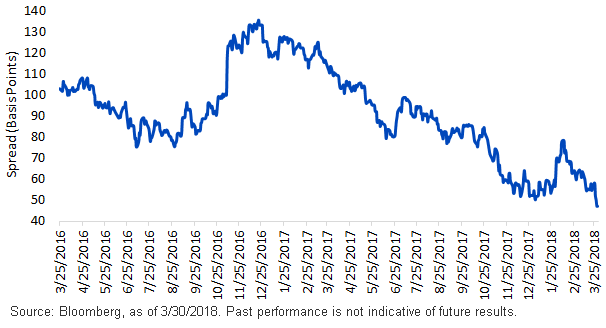
The graph clearly illustrates the overarching trend since late 2016, which has been for the yield curve to flatten. To provide perspective, after hitting a peak reading of 136 basis points (bps) in late December of 2016, the differential between the UST 10-Year and the UST 2-Year yield started narrowing visibly, culminating in the low watermark of +50 bps to begin the current calendar year, the lowest level in more than 10 years.
U.S. Treasury 2-Year vs. 10-Year

Interestingly, what captivated investors’ attention was really the move during the second half of last year. This flattening episode took the UST 2/10 spread from roughly +100 bps down to said low, essentially cutting the differential in half in only a six-month span. The catalyst behind this narrowing trend was the Federal Reserve’s (Fed) monetary policy. As the FOMC raised rates in mid-June and then again in December, with the prospect of three additional hikes in 2018, the UST 2-Year yield was directly affected, rising almost 60 bps as a result. Meanwhile the UST 10-Year yield barely budged, increasing by a little less than 10 bps.
Then something unexpected happened between early January and mid-February of this year: the curve steepened. In this episode, investors witnessed the mirror image of what transpired during the second half of last year, as the UST 2-Year yield rose only a little more than 10 bps, while the UST 10-Year yield surged by over 40 bps. This produced a 2/10 spread of just under 80 bps. The disparity in rate movements earlier this year had more to do with recalibrating the yields for intermediate to longer-dated maturities, as the market began to discount the prospect for stronger economic growth, increasing budget deficits and attendant Treasury supply, and an inflation scare.
Since then, economic data have led to downward revisions of Q1 U.S. real GDP estimates, while a drop in the annual rate of increase for wages in February eased inflation anxieties. It should be noted that the UST market still looks for an improved growth backdrop for 2018 as a whole, and burgeoning Treasury supply is here to stay. Against this backdrop, since the high point in mid-February, the yield curve experienced a renewed flattening phase, with the 2/10 differential narrowing to a new cycle low of 47 bps, as of this writing.
Conclusion
A key factor to watch going forward will be the Fed’s forecast for rate hikes, especially for the remainder of this year. One could make the case that an official shift in the “blue dots” to three additional rate increases rather than the current projection of two moves could result in a continuation of the flattening trade. Although the yield curve may not be done flattening in this cycle, there is a key difference between the end of last year and where we are now; namely, there is little in the way of discussion that a flatter yield curve might be the precursor for a looming recession. As we seem to see on a regular basis, the dialogue can change quickly, so stay tuned…
Unless otherwise stated, data source is Bloomberg, as of March 30th, 2018.


