Why “Passive” Doesn’t Always Mean “Average”


In February 2007, WisdomTree launched the WisdomTree U.S. MidCap Earnings Index, and the WisdomTree U.S. MidCap Earnings Fund (EZM) to track it. With an almost 11-year live track record for reflection, we review why WisdomTree chose to weight this Index by earnings and how this decision has helped the exchange-traded fund (ETF) achieve returns among the top of its Morningstar Category of active and passive peers.
How Valuation Has Been Important
Over a variety of long-term periods, work by Professor Jeremy Siegel in his book The Future for Investors has indicated that the after-inflation returns of equities have held a very close relationship to their earnings yield—the reciprocal of the price-to-earnings (P/E) ratio. In short:
- Higher earnings yields (or lower P/E ratios) have been associated with stronger real returns.
- Lower earnings yields (or higher P/E ratios) have been associated with weaker real returns.
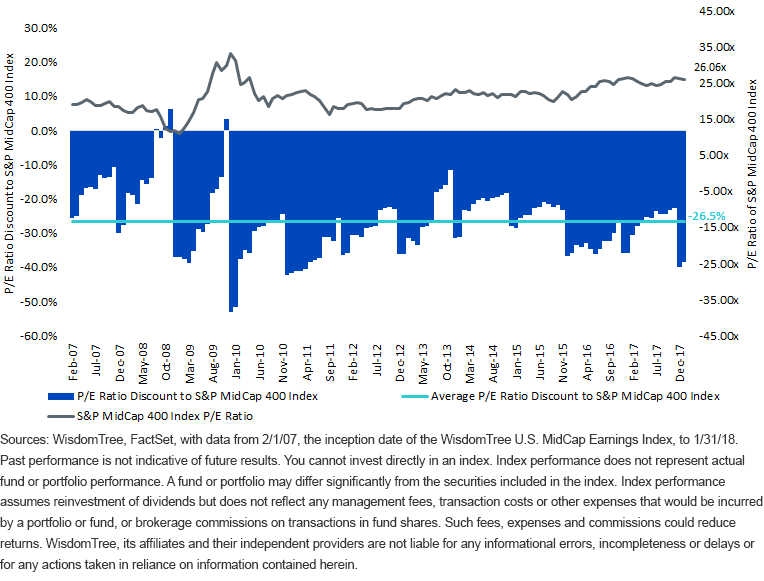
If, for instance, we’re looking at the S&P MidCap 400 Index with a trailing 12-month P/E ratio of 26.1x as of January 31, 2018, that is associated with a 3.8% earnings yield, and it becomes more challenging to see real after-inflation returns to U.S. equities that are too different from this 3.8% level—at least if history is any guide.1
Where WisdomTree’s U.S. MidCap Earnings Strategy Can Help
The WisdomTree U.S. MidCap Earnings Index follows two big-picture steps at its annual rebalance, screened on November 30 of each year:
- Include only profitable companies
- Weight companies by their core earnings
This process has tended to raise earnings yields (same thing said a different way: lower P/E ratios) compared with market capitalization-weighted universes of similar stocks. Below, we focus on the WisdomTree U.S. MidCap Earnings Index P/E relative to the S&P MidCap 400 Index historically.
The WisdomTree U.S. MidCap Earnings Index Has Had a 26.5% Average P/E Ratio Discount Compared with the S&P MidCap 400 Index over Its Live History

The Benefits of a Multi-Factor Rebalance
Factor-based investing is taking on greater importance in portfolio construction. So how does the WisdomTree U.S. MidCap Earnings Index tap into multiple factors that have been associated with long-term outperformance?
Value: This factor was touched on above—a systematic P/E discount to the market cap-weighted benchmark Index has been the result of the annual rebalance.
Quality: We also find that weighting profitable companies by earnings tends to tilt the Index toward stocks with higher measures of return on equity and return on assets, commonly used measures of the quality (or profitability) factor.
Size: Providing purer exposure to the mid-cap segment of the market can also help improve returns over time. As of December 31, 2017, the WisdomTree U.S. MidCap Earnings Index held 100% of its weight in stocks between the $2 billion and $10 billion market cap range in an efficient targeting of the size-factor exposure.
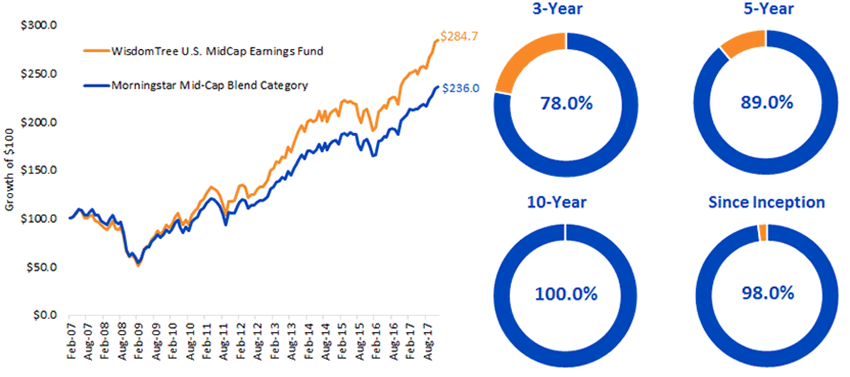
The Result: 100% Outperformance over Trailing 10 Years
The overarching goal of the WisdomTree Index has been the same all along: to unshackle the investor from needing to invest at whatever the market’s earnings yield is by rebalancing annually with a process aimed at actually raising the earnings yield compared to a similar market cap-weighted index.
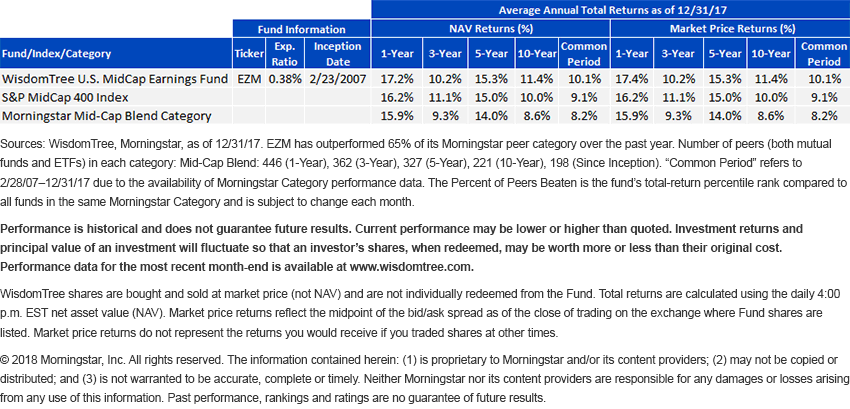
Just as the higher earnings yields of the WisdomTree Index have indicated, over longer periods of time, the investment result for the fund tracking this Index has been outperforming 100% of its Morningstar peer category over the past 10 years, and 98% since its inception.


1Sources: WisdomTree, FactSet.
Important Risks Related to this Article
There are risks associated with investing, including possible loss of principal. Funds focusing their investments on certain sectors and/or smaller companies increase their vulnerability to any single economic or regulatory development. This may result in greater share price volatility. Please read the Fund’s prospectus for specific details regarding the Fund’s risk profile.

Jeremy Schwartz has served as our Global Chief Investment Officer since November 2021 and leads WisdomTree’s investment strategy team in the construction of WisdomTree’s equity Indexes, quantitative active strategies and multi-asset Model Portfolios. Jeremy joined WisdomTree in May 2005 as a Senior Analyst, adding Deputy Director of Research to his responsibilities in February 2007. He served as Director of Research from October 2008 to October 2018 and as Global Head of Research from November 2018 to November 2021. Before joining WisdomTree, he was a head research assistant for Professor Jeremy Siegel and, in 2022, became his co-author on the sixth edition of the book Stocks for the Long Run. Jeremy is also co-author of the Financial Analysts Journal paper “What Happened to the Original Stocks in the S&P 500?” He received his B.S. in economics from The Wharton School of the University of Pennsylvania and hosts the Wharton Business Radio program Behind the Markets on SiriusXM 132. Jeremy is a member of the CFA Society of Philadelphia.

