
“And You May Ask Yourself, Well…How Did I Get Here?”


For a bond market participant, the title of this blog post highlights the lion’s share of questions I’ve been receiving over the last few weeks with respect the U.S. Treasury (UST) 10-Year yield. Consensus estimates did, once again, look for the UST 10-Year yield to rise this year, but the timing and magnitude of the early 2018 move to higher levels have certainly caught most everyone by surprise. In my opinion, the increase was essentially pushed up by at least six months, as we viewed an elevated trading range becoming more acute during the middle to latter part of this year. So then, how did we get here?
Cause and Effect
Without a doubt, the UST market is operating in a different landscape to begin 2018 than it had in the last few years. When searching for reasons behind this increase in the UST 10-Year yield, I like to look at it as being three legs of a stool.
- The recent tax cut is expected to boost economic growth (real GDP) by a few percentage points at a minimum (fiscal stimulus).
- Increasing U.S. budget deficits are leading to increased Treasury supply at the same time the Federal Reserve (Fed) is pulling back on its purchases. Throw in the uncertainty surrounding the European Central Bank’s (ECB) ending and/or tapering its own QE program.
- Inflation expectations have risen, fueled by above consensus readings for both wages and CPI in January.
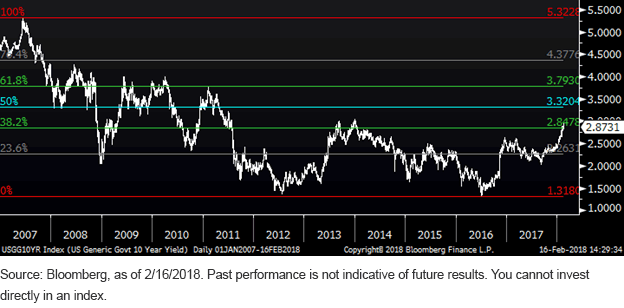
U.S. Generic Government 10-Year Yield
That leads us to the bond market’s perception of potential Fed policy action this year, perhaps the most important “effect” going forward. In the last few years, the fixed income arena has thought the Fed would raise rates fewer times than what the Fed projected in their blue dots report. In contrast, early this year, the bond market has begun to think the Fed may raise rates more than the Fed projected. Three moves have been fully priced in the Fed Funds Futures market, and the conversation has turned to the possibility of a fourth tightening move in 2018 (one rate hike each quarter).
Getting Some Perspective
The obvious question is: Where does the UST 10-Year yield go from here? Technical analysis can offer some potential insights. About a month ago, the yield level broke through the five-year Fibonacci 76.4% retracement level of 2.64%. According to this analysis, the next stop to the upside, which would be a 100% retracement, is at 3.05%. Considering where the UST 10-Year has been trading of late, I thought it would be useful to add another layer to this analysis, namely, what happens if the yield goes above 3.05%. We almost have to go back to the drawing board and look at the retracement levels in place dating back to the beginning of 2007, or before the financial crisis and Great Recession. In this case, the graph above illustrates that a 3.32% level could be put in play.
Conclusion
At some point, the “legs of the stool” have to be validated to maintain this upward trajectory in rates. Indeed, the UST market has now discounted or allowed for the aforementioned negative factors to a certain extent. Consider this fact: the UST 10-Year yield has risen roughly 50 basis points (bps) already in 2018, and a mind-boggling 85-90 bps, as of this writing, since the most recent low watermark on September 7. Forces that helped keep the UST 10-Year yield in check in the past are still evident, such as favorable spreads relative to other developed nations’ government bond yields, and the potential for geopolitical risks. In addition, the relative-strength index is flashing at the “oversold” line. In other words, what if the 3.05% level holds? As I’ve written before, we still have a long way to go in 2018, so don’t get caught up in the moment, but rather prepare your fixed income portfolio utilizing a core approach, complemented with interest rate-hedged strategies.
Unless otherwise noted, data source is Bloomberg, as of February 16, 2018.
Share & Comment
Popular Posts
Categories
Related Links