How Does a Dynamic Portfolio Stack Up vs. 60/40?


Implied volatility is low, but realized volatility is even lower. Many equity investors are concerned about valuations, but strong earnings growth has led to double-digit returns year-to-date.1 In fixed income, the Federal Reserve (Fed) has continued along its path of tightening, but rates are lower year-to-date at tenors greater than five years. Overall, a seemingly naive 60% equity/40% fixed income portfolio2 has delivered enviable performance. During these periods, it’s imperative that investors resist the temptation to be lulled into complacency. Over the last several years, we’ve seen an increased interest in strategies that can serve as alternatives to a standard equity and bond portfolio. While these strategies can be used in isolation, we’ve found that creating a portfolio of alternative assets can provide a wider range of risk and return profiles. Below, we highlight how investors can combine a dynamic long/short equity strategy 3 with a dynamic bearish strategy4 to achieve returns comparable to traditional portfolios but with significantly different drivers and correlations.
Dynamic Long/Short and Bearish
At their core, dynamic strategies seek to add value through security selection and by their ability to dynamically add and subtract exposure to equity market beta. When underlying fundamentals are strong, our dynamic long/short Index is long. When fundamentals become mixed, a partial hedge is applied. When fundamentals are weak, a full market hedge seeks to protect investors from downdrafts in the equity market while still delivering excess returns through security selection. For our bearish strategy, when fundamentals are poor, all equity exposure is eliminated while those proceeds are invested in U.S. Treasury Bills. This high-quality cash position combined with a short position in equity futures allows investors to potentially profit from a decrease in equity prices.
As one of my colleagues wrote previously, we consider them as complements to more specifically target a desired lower beta to the market. Below, we highlight a variety of combinations in these alternative strategies that can serve as a starting point for a liquid alternatives portfolio.
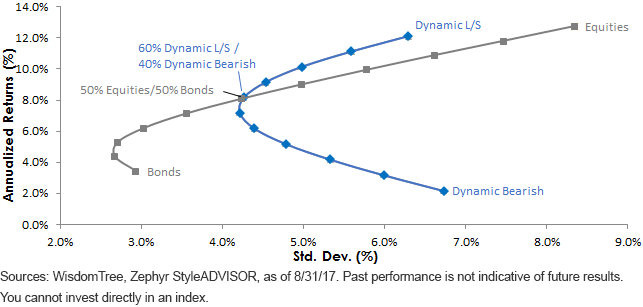
Dynamic Strategy Blend vs. Traditional Asset Blends
11/30/15–8/31/17

Rethinking 60/40
While many investors think of 60/40 as being an appropriate starting point for equity and bond allocations, this can also serve as an interesting starting point for a liquid alts portfolio. Although returns from this portfolio remain heavily dependent on equity performance, they are not necessarily dependent on higher equity price. In effect, if fundamentals begin to deteriorate, it’s possible that investors could still generate positive returns when traditional asset prices fall. In the live performance history above, both dynamic components delivered positive total returns with less volatility than the equity market. Volatility was significantly greater than fixed income strategies over this time, but investors were able to achieve comparable returns and risk by owning dynamic long/short and bearish in a 60%/40% ratio. In our view, this could serve as an interesting starting point for investors looking to establish a new liquid alts portfolio.
The Risk of 60/40
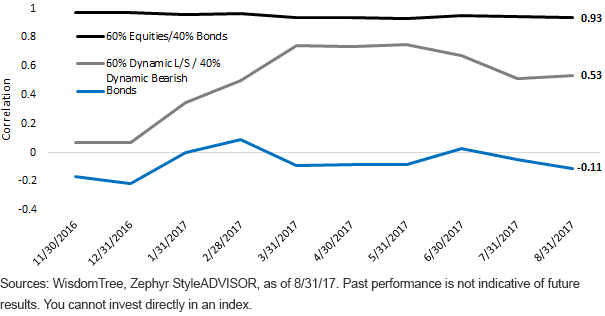
Although these historic rules of thumb for asset allocation have delivered strong returns in recent years, a major problem with these approaches is that they remain highly correlated to equity market risk. Put another way, returns from these portfolios have been strong because equities have compounded at 13% per year5. Fixed income has exhibited very little correlation to the equity market, with yields <3%, but any returns in excess of that number solely depend on interest rates remaining stable or declining. This bet seems optimistic if the global economy continues to expand and inflation ever rises above currently benign levels. Similarly, correlations in these portfolios will remain tied to the equity market unless investors significantly reduce exposure to equity market beta. In our view, dynamic strategies have the potential to achieve this objective much more so than dramatically increasing exposure to fixed income in the midst of a central bank tightening cycle.
Rolling 12-Month Correlations to S&P 500 Index

In sum, although simply constructed portfolios have delivered above-average performance in recent years, it seems unlikely that the pace of such gains can be sustained. When a market correction inevitably occurs, clients could be exposed to more risk than they had intended. In our view, combining traditional assets with dynamic equity strategies could provide opportunities for returns despite a fall in equity prices. By combining long/short and bearish strategies together, investor exposures can be dynamically adjusted based on underlying market fundamentals.
1As measured by the S&P 500 Index, as of 8/31/17.
2Equity and fixed income proxied by the S&P 500 Index and the Bloomberg Barclays U.S. Aggregate Index.
3Proxied by the WisdomTree Dynamic Long/Short U.S. Equity Index.
4Proxied by the WisdomTree Dynamic Bearish U.S. Equity Index.


