Assessing Value in Emerging Market Currencies


During a period of robust inflows and more positive sentiment, emerging markets1 (EM) have outperformed developed markets by a margin of 6%2 to 12%3 year-to-date. This is primarily a function of a rebound in earnings, higher asset prices and a rise in the value of EM currencies against the U.S. dollar. With many emerging equity markets up over 20% year-to-date, the logical question many investors are asking is, “Have I missed the rally?” Using currency foreign exchange (FX) performance as one barometer, we hope to provide greater context for investors considering a strategic shift back to EM assets.
EM FX: A Harbinger of Flows
Over the last several years, we’ve spent a tremendous amount of time speaking about currency risk and analyzing trends in currency markets. We have provided dedicated exposure to EM FX through the WisdomTree Emerging Markets Currency Strategy Fund (CEW) since 2009. In our view, the most significant (and intuitive) driver of EM FX is global demand. When businesses or investors seek to buy an asset or engage in trade in an emerging market, often they convert hard currency into local. If demand for a currency outstrips supply, a currency will tend to appreciate.
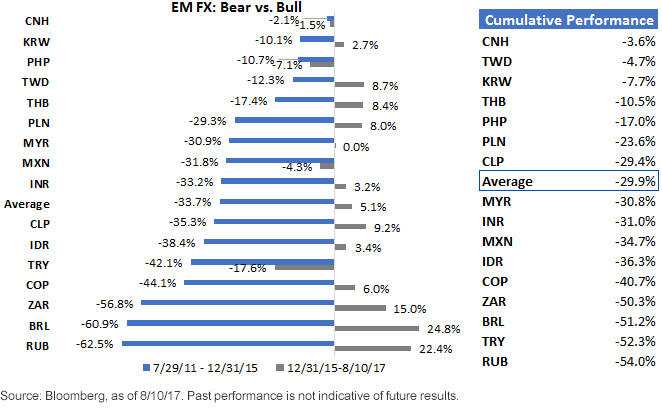
Unfortunately for EM policymakers, the opposite of this process had been occurring over the last five or six years (ahead of 2016). When foreign investors seek to liquidate their holdings and repatriate their foreign currency back to dollars, this leads to a decline in the value of these currencies. From the middle of 2011 to the end of 2015, global investors generally shunned EM assets. As a consequence, EM currencies declined dramatically over this period. As shown in the chart below, EM currencies fell by more than 33% over this four-and-a-half-year period. While Asian currencies depreciated by far less, countries with significant exposure to commodities experienced the most significant devaluations. In the case of Russia, Brazil, South Africa and Turkey, these economic difficulties were exacerbated by geopolitics as well.
Dollar Strength vs. Weakness: 7/29/11–8/10/17

Since 2016, commodity prices have rebounded while volatility in most global markets has declined. Over this period, countries that experienced the most significant devaluation have seen their currencies rebound sharply. On average, EM FX has appreciated by over 5% against the U.S. dollar during this period. In our view, bifurcating these two periods can be instructive on two fronts. First, it provides investors with an idea of the pain that EM FX can provide during a weak EM FX, strong U.S. dollar market. But secondarily, it also shows that there can be fairly dramatic deviations across a group of economies that are anything but homogenous.
However, the most significant takeaway for us is to try to not get caught up on trying to identify specific turning points in the market. Given the carnage many investors experienced from mid-2011 through 2015 and the rebound that we’ve seen recently, the worst of EM FX depreciation in this dollar cycle looks to be behind us. For investors who are allocating to these markets, currencies are down by approximately 30% since the start of the dollar rally in July 2011—even when including recent gains. While there are no guarantees that EM FX will continue to outperform the U.S. dollar, investors considering long-term allocations to EM assets should view local FX performance more as a tailwind compared to a headwind.
Opportunities for Income
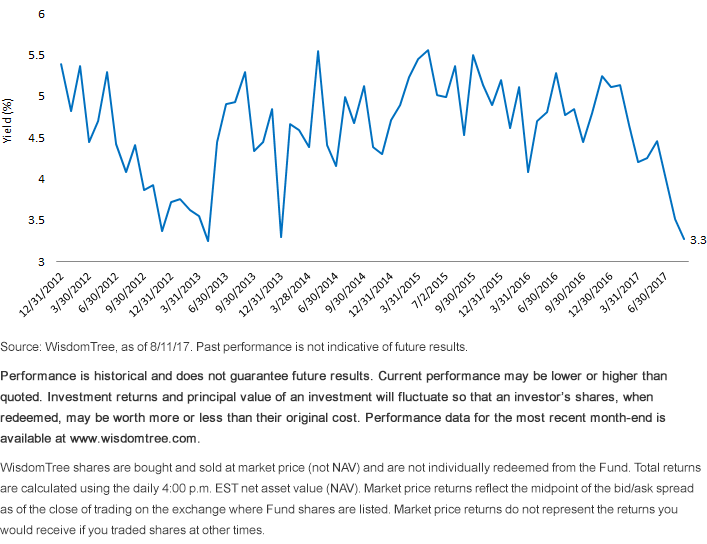
In addition to returns driven by changes in the value of currencies, exposure to EM FX can also provide investors with a meaningful amount of carry. Given that interest rates in most emerging markets tend to be higher than in the U.S., investors that go long a basket of EM currencies via currency forward contracts are usually compensated for bearing this risk. While the level of income depends on U.S. and foreign central bank monetary policy, these higher implied rates provide opportunities for income that can help dampen volatility that’s often associated with investments in EM. As we show below, the embedded income yield component for CEW has averaged 4.6% since 2012.4
Embedded Income Yield (%)

Please click here for CEW standardized performance.
In sum, EM FX can offer significant value relative to 2011 despite recent inflows and appreciation. There is also a strong carry component to the return, with short-term interest rates in these markets that average 3.3% today embedded in forward rates utilized to access these markets. Combining embedded income from forwards, with more positive sentiment to these foreign currencies, we see CEW as a useful tool to increase exposure to positive economic momentum that we see accelerating across the emerging markets.
1As measured by the MSCI Emerging Markets Index through 8/11/17.
2Compared to the MSCI EAFE Index.
3Compared to the S&P 500 Index.
Important Risks Related to this Article
There are risks associated with investing, including possible loss of principal. Foreign investing involves special risks, such as risk of loss from currency fluctuation or political or economic uncertainty. The Fund focuses its investments in specific regions or countries, thereby increasing the impact of events and developments associated with the region or country which can adversely affect performance. Investments in emerging or frontier markets are generally less liquid and less efficient than investments in developed markets and are subject to additional risks, such as risks of adverse governmental regulation and intervention or political developments.
Investments in currency involve additional special risks, such as credit risk and interest rate fluctuations. Derivative investments can be volatile and these investments may be less liquid than other securities, and more sensitive to the effect of varied economic conditions. As this Fund can have a high concentration in some issuers the Fund can be adversely impacted by changes affecting such issuers. Unlike typical exchange-traded Funds, there are no indexes that the Fund attempts to track or replicate. Thus, the ability of the Fund to achieve its objectives will depend on the effectiveness of the portfolio. Due to the investment strategy of this Fund it may make higher capital gain distributions than other ETFs.
Investments in commodities may be affected by overall market movements, changes in interest rates and other factors such as weather, disease, embargoes and international economic and political developments. Commodities and futures are generally volatile and are not suitable for all investors. Please read the Fund’s prospectus for specific details regarding the Fund’s risk profile


