Why Allocating to Cash May Not Be the Best Strategy


In my experience, a large majority of investor portfolios that I come across are strategically allocated anywhere from 1% to 10% in cash. Quite often the objective for this strategic cash allocation is to disinvest a fraction of portfolio beta and, therefore, reduce overall volatility. An allocation to cash makes sense—particularly to fund spending requirements over the short term—but of course, the greater the more defensive positions, the less potential upside participation there is.
What if there were “asset allocation” strategies that reduced volatility but still participated on the upside?
In February 2016, WisdomTree launched a strategy called the WisdomTree CBOE S&P 500 PutWrite Strategy Fund (PUTW) that tracks the CBOE S&P 500 PutWrite Index (PUT). This strategy is designed to collect premiums by selling cash-collateralized S&P 500 Index put options every month. Thus, when complemented with an equity portfolio, it can help reduce portfolio beta and potentially provide higher risk-adjusted returns.
My analysis below proposes an allocation to the Put Write Fund as an alternative to cash or short-duration fixed income to attain higher upside participation while managing volatility in a way that looks similar to allocations of cash and equities. With PUT having nearly 10 years of live track record, we now have the luxury of analyzing results backed by a longer period of time.
PUT—Measuring Risk Reduction Properties by Comparing to S&P 500 and Cash Blends
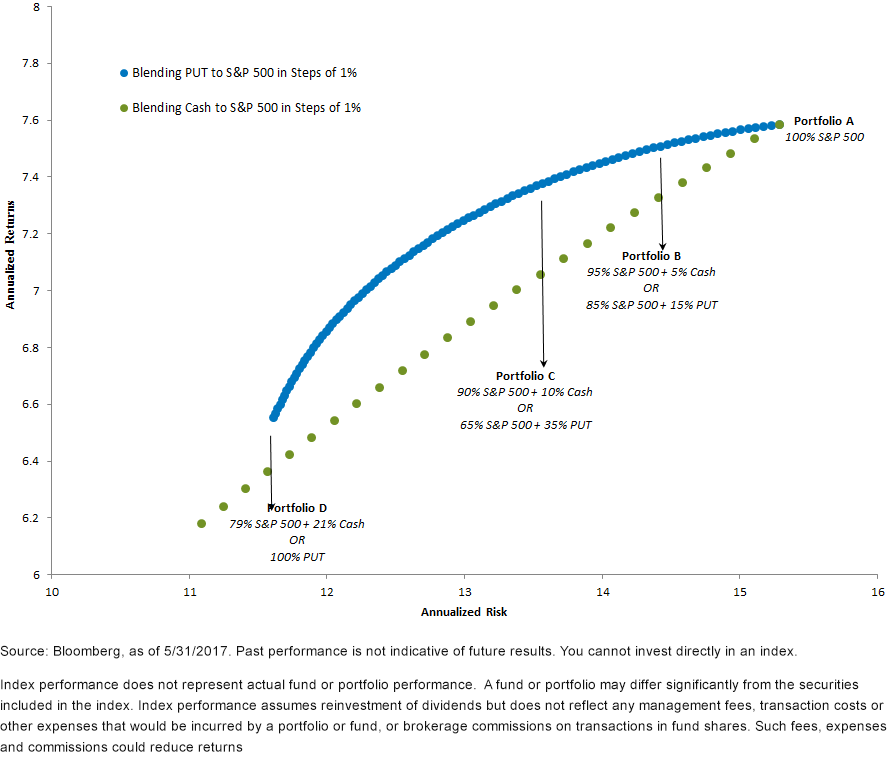
In the chart below, we are starting with a 100% allocation to the S&P 500 (Portfolio A, top right) and then either blending cash (dotted green line) or PUT (blue curve) in increments of 1%. What we see in this chart is that for every cash allocation, investors could have improved their total returns by blending the S&P 500 with PUT instead of cash.
An investor allocating 5% to cash could have achieved similar volatility with higher returns by allocating 15% to PUT. A few other key cash allocations and corresponding PUT allocations are listed below.
- Portfolio A: 100% S&P 500
- Portfolio B: 5% allocation to cash/95% to S&P 500 had similar risk as 15% PUT/85% S&P 500
- Portfolio C: 10% allocation to cash/90% to S&P 500 had similar risk as 35% PUT/65% S&P 500
- Portfolio D: 21% allocation to cash/79% to S&P 500 had similar risk as 100% PUT
Allocating to PUT could Offer Better Risk/Reward Than Cash for Equity Investors (Overall Period 6/30/2007–5/31/2017)

Therefore, different investors could have attained similar risk characteristics with better returns by allocating a different proportion of equity allocations to PUT. In addition, no matter what proportion was allocated to PUT, it would have had better returns than any combination of S&P and cash!
What Happens on a Downside?
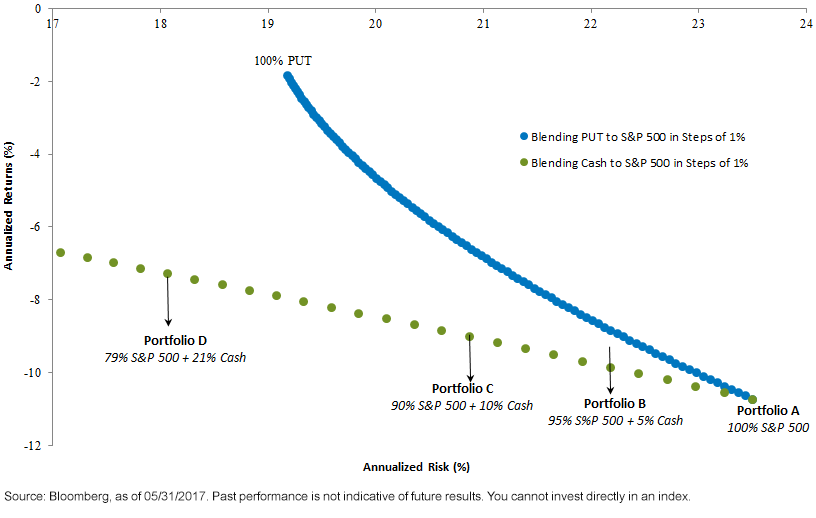
So far, so good. But investors also keep cash to protect downside, thus unless these PUT blends do well on the downside, they are not a true match to cash allocations. The chart below zooms into the two-year period of 2008–2009, i.e., the peak of the financial crisis. During that time, the S&P 500 lost over 20% of its value.
Here again, we clearly see PUT (blue curve) as an alternative to cash (dotted green line) could have generated higher returns, providing a much-needed cushion to investors’ equity portfolios.
PUT Provided Better Risk/Return During Stress Times (Dec 2007–Dec 2009)

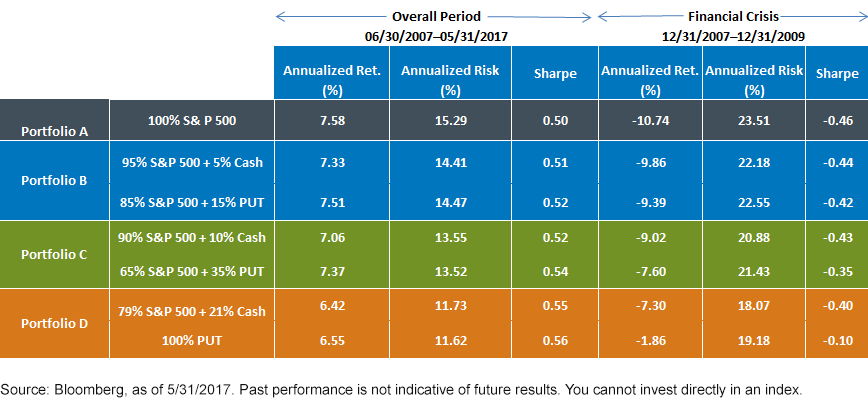
Summarizing Risk/Return of Blends Above
In the table below, we quantify and compare our key portfolios above for overall period as well as for the period of the financial crisis. Not only did PUT alternatives have better returns for the entire period, but they also outperformed their cash peers during stress times.
For example, Portfolio C, with 10% Cash/90% S&P 500 vs. 35% PUT/65% S&P 500:
- Overall period – PUT alternative outperformed by 31 basis points (bps) annualized, with very similar risk
- Financial crisis – PUT alternative outperformed by 142 bps annualized, with slightly higher risk

Conclusion
Blending in PUT produced results from a risk-reduction standpoint that look like allocating a portion of equities to cash. However, by allocating to cash, investors usually lose upside participation in the market. Utilizing PUT could have historically provided a better risk/return experience.
PUTW is a way for investors to gain access to PUT, which, as illustrated above, has the potential to offset a decline in the value of the S&P 500 to the extent of the premiums received. Thus, from an asset allocation perspective, blending PUTW with an equity portfolio could not just potentially lead to an overall lower beta, but—unlike cash—could also participate on the upside, thus offering investors a potential alternative for a cash-allocation-like volatility but with potentially higher returns.
Important Risks Related to this Article
There are risks associated with investing, including possible loss of principal. The Fund will invest in derivatives, including S&P 500 Index put options (“SPX Puts”). Derivative investments can be volatile, and these investments may be less liquid than securities, and more sensitive to the effects of varied economic conditions. The value of the SPX Puts in which the Fund invests is partly based on the volatility used by market participants to price such options (i.e., implied volatility). The options values are partly based on the volatility used by dealers to price such options, so increases in the implied volatility of such options will cause the value of such options to increase, which will result in a corresponding increase in the liabilities of the Fund and a decrease in the Fund’s NAV. Options may be subject to volatile swings in price influenced by changes in the value of the underlying instrument. The potential return to the Fund is limited to the amount of option premiums it receives; however, the Fund can potentially lose up to the entire strike price of each option it sells. Due to the investment strategy of the Fund, it may make higher capital gain distributions than other ETFs. Please read the Fund’s prospectus for specific details regarding the Fund’s risk profile.

