
Why Buybacks Matter


Share buybacks have become a major focus of conversation within the investment industry—most recently due to speculation that if the U.S. government were to institute some sort of “repatriation holiday,” profits currently being held overseas to avoid taxation would be utilized largely for share repurchases to thereby “goose” earnings-per-share (EPS) growth by reducing the number of shares outstanding.
However, in a broader sense, do firms that implement share buyback programs actually lead to stronger returns?
The Importance of Net Issuance
When judging a firm’s share buyback behavior, it’s critical to think in terms of the net change in the number of shares outstanding, as opposed to any gross level of share buybacks. Firms issue shares to raise capital that they cannot otherwise access, as they wouldn’t want to give away ownership in future profits lightly. Therefore, we look at four distinct groups of stocks based on net share issuance behavior:1
- Share Reducers: These are firms that were implementing more share buybacks than share issuance and therefore saw their number of shares outstanding decrease each year.
- No Change in Issuance: These are firms that might have been buying back shares and might have been issuing shares, but overall there was no change in the number of shares outstanding each year.
- Low Share Issuers: These are firms that ranked in the lowest 20% of share issuers—in other words, their shares outstanding did increase, but on the lower end of the spectrum.
- High Share Issuers: These are firms that ranked in the highest 20% of share issuers—in other words, these companies needed capital, and share issuance was a heavily utilized avenue by which to raise it.
How Net Issuance Led to Differentiated Equity Returns in U.S. Equities
(Cumulative Growth of $1,000 Based on Share Issuance Groupings)
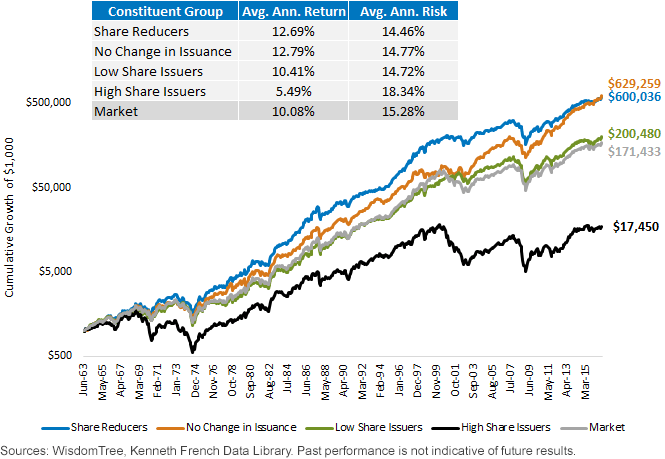
- Share Reducers, No Change in Issuance and Low Share Issuers Outperformed the Market: Not only did these three groups of stocks outperform the market, they did so with lower risk.
- High Share Issuers Dramatically Underperformed: The High Share Issuers underperformed to such an extent that it makes sense to think that avoiding these firms was one of the strongest contributors to relative outperformance of the other groups against the broad market.
At WisdomTree, Which U.S. Equity Index Had the Greatest Exposure to Share Reducers?
There are two reasons to ask this question today, in our opinion:
- Share Reducers indicate a strong signal of quality, given that they have access to capital to such an extent that they can utilize a portion of it to actually reduce the number of shares that they have outstanding. This combines with how Share Reducers were shown earlier to have stronger long-term returns than the broad market.
- Investors may currently be thinking about the potential of a repatriation holiday and could be seeking to position themselves in stocks that are already indicating a strong tendency toward buybacks.
Net Buyback Ratio + Dividend Yield = Total Shareholder Yield
For much of history, if U.S. corporations wanted to return profits to their shareholders, dividends were seen as the only option. It wasn’t until 1982 that the Securities and Exchange Commission adopted Rule 10b-18, which gives corporations a “safe harbor” against charges of stock-market manipulation if buybacks are below a certain level relative to average daily volume.2 For those looking at historical payout ratios, after that point it becomes important to consider both dividends and buybacks as opposed to solely looking at dividends.
In our view, total shareholder yield is the measure that currently best represents the return of capital to shareholders in U.S. equities.
WisdomTree’s U.S. Indexes Ranked by Total Shareholder Yield
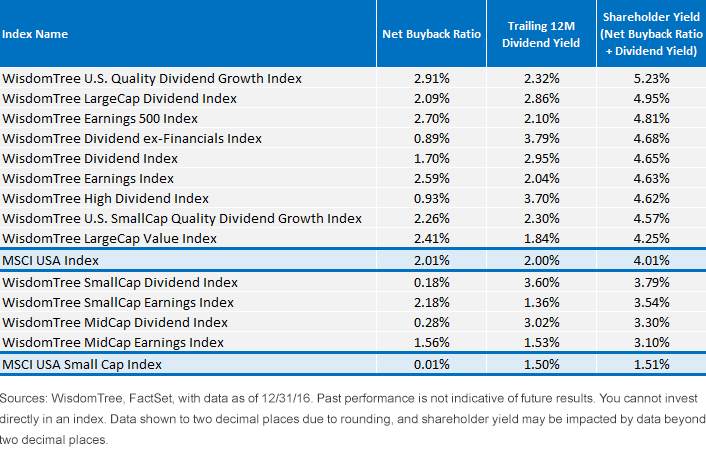
For definitions of indexes in the chart, visit our glossary.
- WisdomTree U.S. Quality Dividend Growth Index: With a net buyback ratio that is almost 50% higher than that of the MSCI USA Index, this Index had the highest total shareholder yield for any of WisdomTree’s U.S. equity Indexes.
- WisdomTree U.S. SmallCap Quality Dividend Growth Index: What might be even more interesting is how the WisdomTree U.S. SmallCap Quality Dividend Growth Index had a net buyback ratio of 2.26%—greater than that of the MSCI USA Index. This is impressive since share buybacks that actually reduce shares outstanding are largely a large-cap phenomenon. We believe it speaks to the alignment of WisdomTree’s Quality Dividend Growth methodology with characteristics that are common to companies that reduce their shares outstanding.
Does either of the WisdomTree U.S. Quality Dividend Growth Indexes shown above actually focus on buybacks directly as a component of Index methodology? In a word, no—buybacks are not a specified selection or weighting criterion. However, it’s clear that these methodologies have consistently provided exposure to share-reducing firms. Why? Firms that have high levels of profitability—return on equity (ROE) and return on assets (ROA)—are able to return cash to shareholders, whether through dividends or buybacks, and many choose to do so with buybacks.
While many firms are not responsible in their conduct of buybacks and buy at levels above their fair values, by and large we have found that buybacks have provided a return advantage over the market. This is one of the reasons we believe our Quality Dividend Growth Indexes—both for the U.S. large-cap and small-cap markets—are attractively positioned today.
1These groupings of stocks are accessible through the Kenneth French Data Library for the period from 6/30/1963 to 12/31/2016 as of this writing.
2 Source: William Lazonick, “To Boost Investment, End S.E.C. Rule that Spurs Stock Buybacks,” The New York Times, 3/6/15.
Important Risks Related to this Article
Dividends are not guaranteed, and a company currently paying dividends may cease paying dividends at any time.
Share & Comment
Popular Posts
Categories
Related Links
Christopher Gannatti began at WisdomTree as a Research Analyst in December 2010, working directly with Jeremy Schwartz, CFA®, Director of Research. In January of 2014, he was promoted to Associate Director of Research where he was responsible to lead different groups of analysts and strategists within the broader Research team at WisdomTree. In February of 2018, Christopher was promoted to Head of Research, Europe, where he was based out of WisdomTree’s London office and was responsible for the full WisdomTree research effort within the European market, as well as supporting the UCITs platform globally. In November 2021, Christopher was promoted to Global Head of Research, now responsible for numerous communications on investment strategy globally, particularly in the thematic equity space. Christopher came to WisdomTree from Lord Abbett, where he worked for four and a half years as a Regional Consultant. He received his MBA in Quantitative Finance, Accounting, and Economics from NYU’s Stern School of Business in 2010, and he received his bachelor’s degree from Colgate University in Economics in 2006. Christopher is a holder of the Chartered Financial Analyst Designation.