How Small Is Your Small-Cap Index?


After Donald Trump’s presidential election victory on November 8, 2016, U.S. small-cap stocks enjoyed a significant upward move. We believe further interest is justified in the following scenarios:
- If there is corporate tax reform, we’ve found that small-cap stocks do in fact tend to pay higher effective tax rates than large-cap stocks. If the statutory rate for U.S. corporations is lowered from the current 35% to 25% (or lower), the biggest incremental impact could hit profitable, small-cap companies.
- If U.S. Federal Reserve (Fed) policy does lead to a stronger U.S. dollar, small-cap stocks, which garner most of their revenues from within the U.S., as opposed to exports, could see less of a headwind to their competitiveness than large caps, which tend to be much more globally oriented.
But What Is a Small Cap?
Interestingly, there are no universally accepted definitions for large caps, mid-caps or small caps. WisdomTree often defines its small-cap Indexes using a concept that determines the percentage of total market cap of its respective universes. For reporting purposes, we also broadly categorize size according to the following classifications: Stocks with market capitalizations below $2 billion constitute small caps, while stocks between $2 billion and $10 billion constitute mid-caps and stocks above $10 billion constitute large caps.
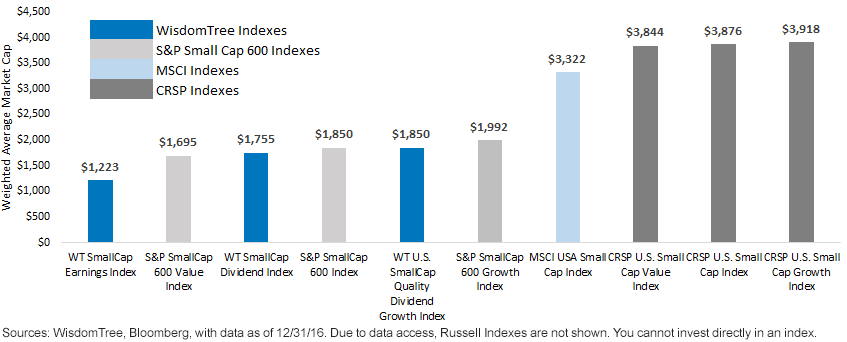
How Different Are Commonly Followed U.S. Small-Cap Indexes? (data in millions)
 For definitions of indexes in the chart, visit our glossary.
A Key Size Metric
- Weighted Average Market Capitalization: This is an important metric to consider in that it combines the actual market capitalization size of the firms with the weighting mechanism of the Indexes. The WisdomTree SmallCap Earnings Index is weighted by earnings, whereas the WisdomTree SmallCap Dividend and U.S. SmallCap Quality Dividend Growth Indexes are weighted by dividends. Stocks that are 1) included and then 2) weighted more highly would have the greatest influence.
- WisdomTree SmallCap Earnings Was the Smallest: In terms of weighted average market capitalization, it was the smallest index at approximately $1.2 billion.
- WisdomTree & S&P SmallCap 600 Indexes shown in this chart all generally find themselves in that “below $2 billion” category. This is distinctly different from the MSCI and CRSP Indexes—notable in that the CRSP Indexes have weighted average market capitalizations approaching $4.0 billion, three times larger than the WisdomTree SmallCap Earnings Index. This raises the question, is the CRSP U.S. Small Cap Index really weighted more toward the mid-cap spectrum?
Does Size Exposure Matter in Small Caps?

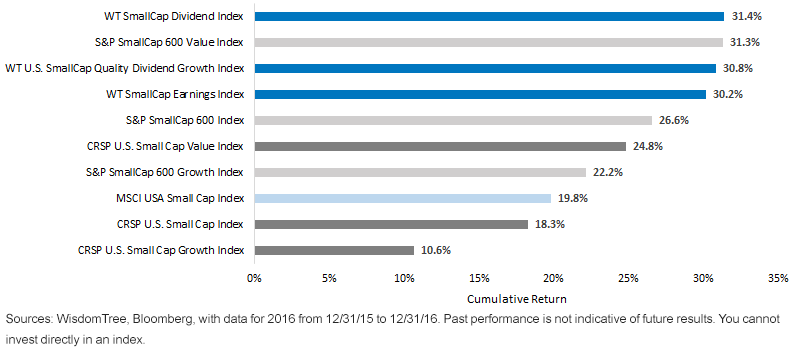
- Smaller Weighted Average Market Cap=Better Performance in 2016: While we certainly couldn’t say that this would always be the case, the more important point is that—even though these are all Indexes focused on U.S. small-cap stocks—there was a spread of greater than a cumulative 20% between the top and bottom performers. It clearly matters how the exposure is garnered. 2016 is an example of a year when the small-cap theme worked well, and it’s interesting that the small-cap Indexes from CRSP and MSCI that had higher weighted average market capitalizations did not perform as strongly.
- Value Led Growth in 2016: WisdomTree’s Dividend Indexes reached their 10-year anniversary of live performance on June 1, 2016, while WisdomTree’s Earnings Indexes hit this same milestone on February 1, 2017. During both of these distinct 10-year periods, the growth style generally outperformed the value style across the market capitalization size spectrum. However, 2016 showed an important shift in the small-cap Indexes we discuss here, with the value style outperforming the growth style. Whether or not value continues to perform well, it’s important to note that WisdomTree’s focus on a relative value rebalance is important in helping mitigate the risk of exposure to stocks that might have outperformed their fundamentals, thereby refreshing valuation characteristics on an annual basis.
WisdomTree’s Earnings Indexes Hit 10 Years of Live History
If people asked us—assuming that the corporate tax reform proposed by President Trump passed in some version—what our strongest small-cap offering would be, we would cite the WisdomTree SmallCap Earnings Index. This Index has 10 years of live calculation and includes only profitable companies—in other words, the ones that would benefit from a reduction in taxes, as opposed to those with negative earnings. It additionally has a strong historical track record of generating returns when interest rates have risen—a consequence we believe to have high potential if President Trump’s stimulus plans are passed.
Important Risks Related to this Article
Dividends are not guaranteed, and a company currently paying dividends may cease paying dividends at any time.Investments focusing on certain sectors and/or smaller companies increase their vulnerability to any single economic or regulatory development.

Christopher Gannatti began at WisdomTree as a Research Analyst in December 2010, working directly with Jeremy Schwartz, CFA®, Director of Research. In January of 2014, he was promoted to Associate Director of Research where he was responsible to lead different groups of analysts and strategists within the broader Research team at WisdomTree. In February of 2018, Christopher was promoted to Head of Research, Europe, where he was based out of WisdomTree’s London office and was responsible for the full WisdomTree research effort within the European market, as well as supporting the UCITs platform globally. In November 2021, Christopher was promoted to Global Head of Research, now responsible for numerous communications on investment strategy globally, particularly in the thematic equity space. Christopher came to WisdomTree from Lord Abbett, where he worked for four and a half years as a Regional Consultant. He received his MBA in Quantitative Finance, Accounting, and Economics from NYU’s Stern School of Business in 2010, and he received his bachelor’s degree from Colgate University in Economics in 2006. Christopher is a holder of the Chartered Financial Analyst Designation.

