An Asset Allocation Study for a Moderate Portfolio


Typically, moderate allocations are tracked against a 60/40 equity/fixed income benchmark. Ideally, while constructing such allocations, a manager would attempt to outperform by tactically over-weighting or under-weighting portions of the market or through the choice of which investment strategy to implement in various sleeves.
Below, I will show how WisdomTree’s dividend methodology compares to a market cap-weighted 60/40 value benchmark without making any tactical bets. In addition, for those willing to alter asset allocations, we believe a continuous improvement in returns per unit of risk could be realized.
Moving from Market Cap 60/40 to WisdomTree 60/40
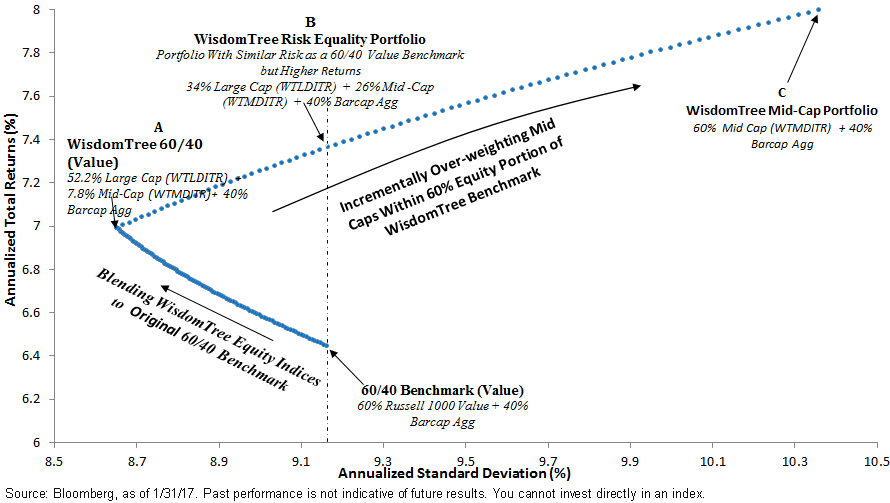
In the chart below, we begin our journey at the central bottom where our benchmark allocation lives and go in a clockwise direction, making stops at allocations A, B and C.
The benchmark we show here is a traditional cap-weighted 60/40 combination consisting of the Russell 1000 Value and Barclays U.S. Aggregate Total Return Indexes. Traveling along the lower edge, we gradually blend an 87% and 13% split of the WisdomTree LargeCap (WTLDI) and MidCap Dividend (WTMDI) Indexes to the equity portion of our starting benchmark while keeping the fixed income portion intact. A static split of 87/13 between large- and mid-cap distribution attempts to keep consistent with the Russell 1000 Value Index market cap breakdowns.1
Asset Allocation Using WisdomTree Dividend Index Family
6/30/06−1/31/17

For definitions of indexes and terms in the chart, visit our glossary.
Reducing Risk, Increasing Return
It is clear that as we blend WisdomTree dividend Indexes there is a continuous reduction of annualized volatility and improvement of annualized total return. Put another way, a manager tracking a 60/40 cap-weighted value benchmark could have potentially outperformed by blending the WisdomTree LargeCap and MidCap Dividend Indexes into their equity allocations.
In fact, an allocation consisting solely of WisdomTree Indexes (i.e., WisdomTree 60/40 or allocation A in the chart above) would have outperformed by 55 basis points (bps) with 51 bps of lower volatility on annualized basis.2
The results show an improved performance on a risk-adjusted basis without taking an asset allocation bet!
Performance of Benchmark & WisdomTree 60/40 Allocation

How About If We Change the Asset Allocation?
1. Moving Away From Large Caps to Mid Caps For a Static 60/40 Allocation
Now that we have established the outperformance generated by WisdomTree’s dividend Indexes without altering asset allocation, let’s take it a step further. What if we over-weight mid-cap equities? How would that change investors’ positioning on the efficient frontier?
For the next stop, we start with our allocation A consisting of all WisdomTree equities (87/13 split of large/mid-cap, consistent with Russell 1000 Value) and gradually over-weight mid-caps. As we move away from large-cap equities to mid-cap equities, we again notice a monotonous increase in annualized returns, though this time with increasing volatility.
On our way along the upper edge of this efficient frontier, our first stop is allocation B. In this allocation, we have an approximate 57/43 split of large- and mid-cap equities (34% large cap and 26% mid-cap, for a total 60% equity allocation) implemented again through WisdomTree dividend Indexes.
This allocation is interesting because it over-weights mid-cap equities and has therefore outperformed by 72 bps on an annualized basis, while maintaining the same volatility as our original benchmark.3
Performance of WisdomTree Risk-Equality & Mid-Cap Allocation

Finally, if we go all the way to the last stop on the upper edge of our chart above, we get our allocation C, with 60% in the WisdomTree MidCap Dividend and 40% in the Barclays bond Index. Although this allocation had higher volatility, it generated more than 100 bps of annualized outperformance over the benchmark.4 Thus, on a risk-adjusted basis, it kept pace with increasing volatility by generating excess returns.
2. Moving Away from a 60/40 Model Itself, i.e., Over-weighting Equities
So far we have kept a constant 60% equity allocation. Another equally interesting question is, can I over-weight equities without increasing risk relative to our benchmark?
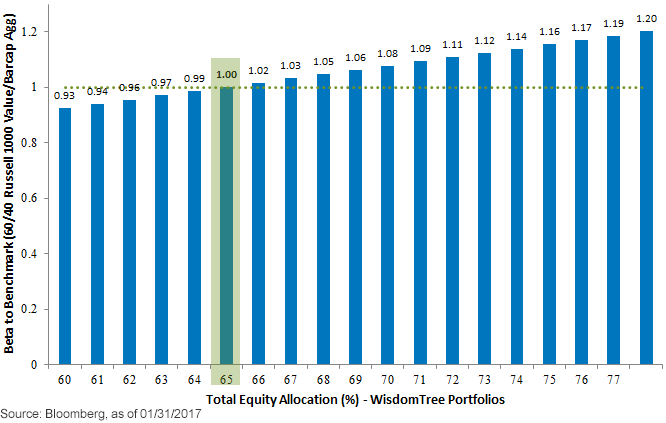
The chart below shows beta, i.e., a measure of risk for various WisdomTree allocations to our standard 60/40 benchmark, above. Each WisdomTree equity allocation is split 87:13 into large and mid-caps (as above) to ensure consistency with our Russell 1000 Value benchmark. The chart shows that by using WisdomTree component in equity piece, investors could have historically over-weight equities by up to 5% without increasing sensitivity (beta) or risk compared to a benchmark.
Beta to a 60/40 Russell 1000/Barcap Agg Benchmark
WisdomTree Portfolio with Varying Equity Percentages and Rest in Barcap Agg
6/30/2016–12/31/2016

Conclusion
It is clear that, historically, a manager who incorporated an element of WisdomTree’s fundamentally weighted dividend strategies would have benefitted from the outperformance over a cap-weighted benchmark during that period.
To an extent, WisdomTree’s methodology also permitted investors to over-weight market segments such as mid-cap or even total equity allocation, which potentially generates higher returns over longer periods.
Our smart beta strategies have added value to investors’ portfolios, and WisdomTree’s core dividend family now has more than 10 years of proven track record. We believe blending WisdomTree’s methodology to an all-cap-weighted portfolio can potentially yield better results for investors.
1Source: Bloomberg, as of 1/31/17.
2Source: Bloomberg, as of 1/31/17.
3Source: Bloomberg, as of 1/31/17.
4Source: Bloomberg, as of 1/31/17.
Important Risks Related to this Article
Dividends are not guaranteed, and a company currently paying dividends may cease paying dividends at any time.
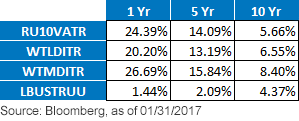
Annualized Performance of Indexes as of 1/31/17


