
Emerging Market Local Debt: A Seasonal Opportunity


So far this year, emerging market (EM) bonds, currencies and equities have outperformed many corresponding U.S. asset classes. The EM rally stands in marked contrast to EM disappointments in January the past three years and is all the more surprising given struggles in both Mexico and Turkey. Investors can now look forward to an investment window that recently has been characterized by EM outperformance and strong absolute returns. Over the last 11 years (the inception of the local debt index1), the three-month investment window from February 1 through April 30 has, on average, produced the strongest returns for EM assets, in particular EM local debt and EM equities,2 and generated the fewest and the smallest shortfalls.
As seen in the table below, EM performance within the February-through-April window is distinct from other three-month investment windows. EM local debt, corporate,3 USD-based sovereigns4 and equities all post their most consistent performance during the window. While other windows tend to be lifted by greater one-time gains, the gains during the early spring period tend to be consistent, and losses are less frequent and shallower in scope.
EM Asset Returns and U.S. Benchmark Average Returns over Rolling Three-Month Calendar Windows
for Horizons Ending 3/31/06–12/31/16
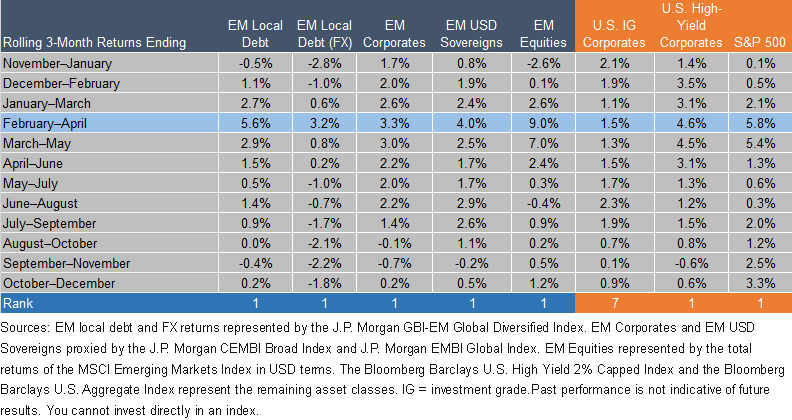
For definitions of indexes in the chart, visit our glossary.
A Spotlight on EM Local Debt
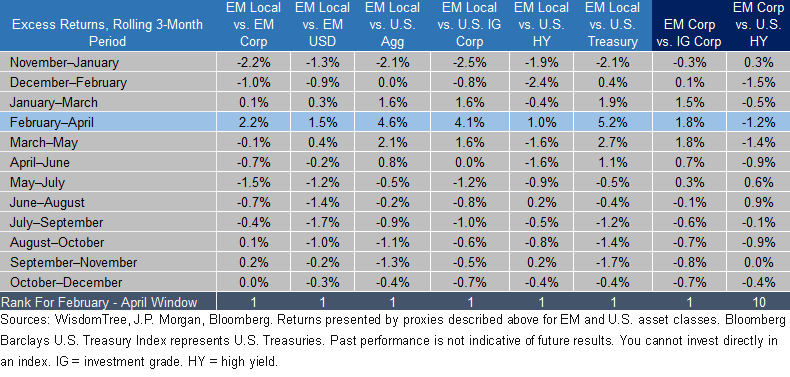
Among the bond sectors, EM local debt shines brightest during this period, generating substantial excess returns versus EM corporate and EM USD sovereigns. Positive contribution from foreign exchange (FX) is a significant piece of this excess return performance. The local bond returns are robust but still lag both EM corporate and USD-denominated sovereign bonds in isolation. In particular, the falling rate environment has been a very supportive tailwind for much longer-duration USD sovereign debt market proxies. The estimated 3% boost from FX gains pushes local debt to the fore.
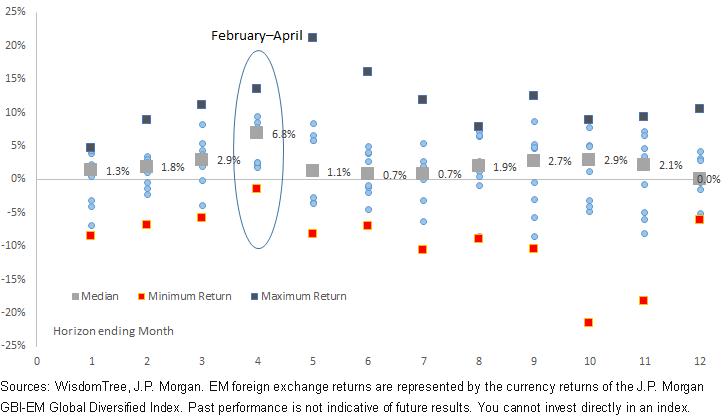
EM Local Debt: Distribution of Returns for Rolling Three-Month Windows
(1/1/06–12/31/06)
The strength in local debt and currency performance was also broad-based. On an aggregate level, each region (Latin America, Europe, Africa and Asia) registered its best average performance during the February –through-April window. 65% of the individual countries posted their best average returns during this window. This number grows to 80% if you expand it to the top two windows. On a given year, 80% of the countries represented by local debt issuers typically produced positive returns.
EM local debt has also outperformed relative to U.S. high-yield debt, U.S. investment-grade corporates and the Bloomberg Barclays U.S. Aggregate Index (the Agg) during this period. The sole negative February-through-April return period for EM local debt was a loss of 1.4% in 2015; the other 10 were positive. 2015 was also the only February-through-April window in which the Agg outperformed EM local debt.
Average Excess Returns of EM Local Debt versus Other Fixed Income Assets, Rolling Three-Month Periods
for Horizons Ending 3/31/06–12/31/17
Catalysts and Potential Investment Implications
What is behind this? A couple of reasons come to mind. In the last few years, U.S. economic momentum slipped sharply in the first quarter, reducing expectations for Federal Reserve vigor and pressuring the dollar against most currencies.5 Indeed, the United States dollar has tended to fall in value against both emerging market and developed market currencies during this 11-year period. Dollar weakness typically correlates with higher commodity prices, which lends support to some of the commodity-intensive EM countries. (The Bloomberg Commodity Index also enjoyed its strongest returns in the February-through-April window over the 11-year period.) Currency performance in Russia, Colombia, South Africa and Brazil, are significant contributors in the February-through-April anomaly. Anxiety about the future trajectory of Chinese growth has been a constant source of concern before Chinese New Year in January, yet seems to dissipate in the months immediately thereafter. The smaller drawdowns in this window (relative to other three-month horizons) also suggest the absence of a significant risk event. Interest rates were largely well behaved, and credit spreads have tightened in the first four months of many of the last 10 years.
Still the February-through-April period has provided a seasonal window to tactically increase exposure to non-U.S. assets. Among EM debt options, it has been a window in which EM local debt has traditionally shined relative to both other EM debt options and domestic fixed income options. Despite the strength of recent performance, local debt yields could offer a considerable cushion relative to other credit products, including U.S. high yield. EM fundamentals have been gaining strength and are steadily outpacing those of developed market countries. Relative to 2013, EM economies are not nearly as extended, with fiscal budgets and trade balance in much better shape. The concept of emerging markets having a thicker skin than in years past seems appropriate given the recovery we have seen in fundamentals, and the February-through-April window could offer an opportunity to take advantage.
1As measured by the J.P. Morgan GBI-EM Global Diversified Index. Inception: 12/1/05.
2As measured by the MSCI Emerging Markets Index.
3As proxied by the J.P. Morgan Corporate Emerging Market Bond Index – Broad (CEMBI Broad).
4As proxied by the J.P. Morgan Emerging Market Bond Index – Global (EMBI Global).
Important Risks Related to this Article
Fixed income investments are subject to interest rate risk; their value will normally decline as interest rates rise. In addition, when interest rates fall, income may decline. Fixed income investments are also subject to credit risk, the risk that the issuer of a bond will fail to pay interest and principal in a timely manner or that negative perceptions of the issuer’s ability to make such payments will cause the price of that bond to decline.
Share & Comment
Popular Posts
Categories
Related Links
Rick Harper serves as the Chief Investment Officer, Fixed Income and Model Portfolios at WisdomTree Asset Management, where he oversees the firm’s suite of fixed income and currency exchange-traded funds. He is also a voting member of the WisdomTree Model Portfolio Investment Committee and takes a leading role in the management and oversight of the fixed income model allocations. He plays an active role in risk management and oversight within the firm.
Rick has over 29 years investment experience in strategy and portfolio management positions at prominent investment firms. Prior to joining WisdomTree in 2007, Rick held senior level strategist roles with RBC Dain Rauscher, Bank One Capital Markets, ETF Advisors, and Nuveen Investments. At ETF Advisors, he was the portfolio manager and developer of some of the first fixed income exchange-traded funds. His research has been featured in leading periodicals including the Journal of Portfolio Management and the Journal of Indexes. He graduated from Emory University and earned his MBA at Indiana University.