Emerging Market ETF Flows Concentrated in 2016—but Not at the Top

josephtenaglia
Director, Model Portfolios
02/15/2017

2016 marked a remarkable turnaround for emerging markets (EM) equities. Following three consecutive years of negative performance, the MSCI Emerging Markets Index returned 11.2%1 in 2016, which was its best annual performance since 2012. 


Behavioral finance has proven that flows tend to chase performance, and in 2016, EM equities were no exception to the rule. Looking at both the broad market as well as individual country funds, EM stock exchange-traded funds (ETFs) took in $18.034 billion in 2016, an incredible number for an asset class that had seen only one year of inflows since 2012.2


However, not all EM ETFs were beneficiaries of these flows, as digging past the headline number reveals an interesting story.


Flows Return, but Only to a Handful of Funds


Of the flows that went into EM stock ETFs in 2016, three ETFs took in the vast majority of the money. In fact, these three funds collectively brought in $17.3 billion of the $18 billion total inflow—accounting for more than 95% of the total flows of the entire asset class!3


These three ETFs are among the largest in the EM universe, based on their current assets under management. It stands to reason that larger funds beget larger flows, but the sheer percentage of flow concentration is certainly a sight to behold.


Did Flows Correlate to Relative Performance?


Normally, when flows seem magnetized to such a small number of funds, rational observers may assume the reason behind that phenomenon is because these specific strategies have trailing performance near the top of their peer group. However, that was hardly the case for these three ETFs. In fact, the indexes currently tracked by two of the ETFs that took in the most inflows in 2016 both trailed the MSCI Emerging Markets Index (the index that is tracked by the third ETF)


On the flip side, two of WisdomTree’s longest-tenured diversified EM Indexes, the WisdomTree Emerging Markets High Dividend Index (WTEMHY) and the WisdomTree Emerging Markets SmallCap Dividend Index (WTEMSC), each outperformed the MSCI EM index by at least 4.7%, landing them both in the upper echelon of emerging markets strategies in 2016.


2016 Performance 
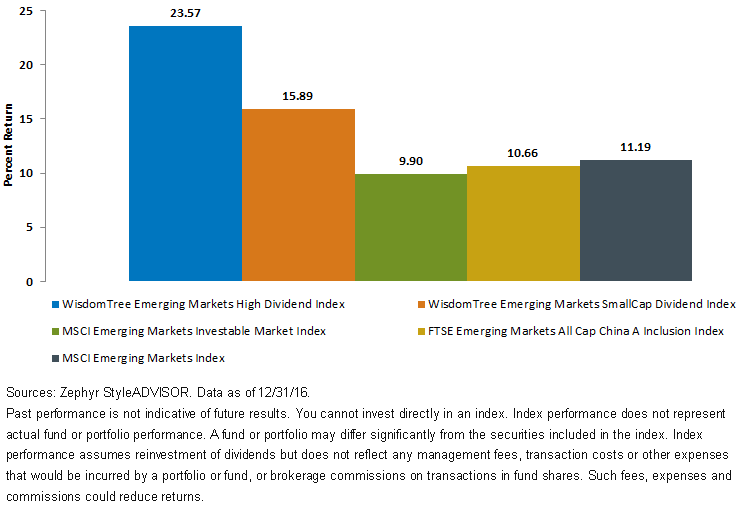
WTEMHY 2016 Performance

For definitions of indexes in the chart visit our glossary. 
 

Extreme Excess Performance without Extreme Excess Volatility


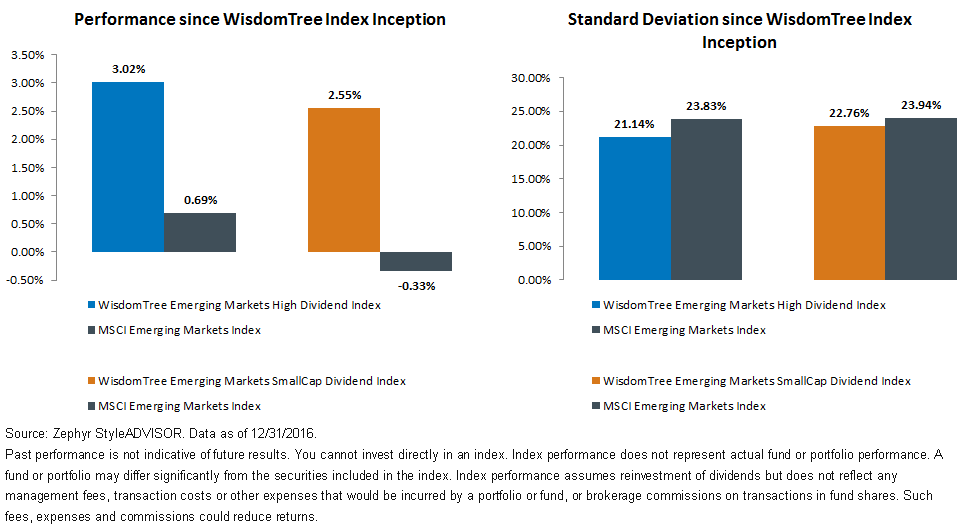
The outperformance of both the WisdomTree EM High Dividend Index and EM SmallCap Dividend Index is notable for a few reasons. Over the past few years, the EM High Dividend Index has typically has been over-weight in the more commodity-linked sectors in EM, Energy and Materials. Given the rally in oil prices in 2016, these two sectors were the top-performing sectors in emerging markets in 2016, which helped boost the WTEMHY’s relative performance. However, this extreme excess performance did not come with the additional cost of extreme excess volatility. In fact, WTEMHY had a standard deviation of 18.15% relative to the MSCI Emerging Markets Index’s 17.78%4, which is a trade-off that many investors would happily exchange for an additional 12 percentage points of return.


For WTEMSC, the reasons behind its performance are also worth discussing. In many global equity markets, the “small-cap premium” is known to exist, which helps explain the performance of small-cap stocks above that of larger stocks. The small-cap return premium held true in the U.S. in 2016, but within emerging markets, the story was starkly different. 


Although the MSCI Emerging Markets Index (which is mostly invested in large-cap stocks) returned more than 11% in 2016, small caps greatly lagged, and the MSCI Emerging Markets Small Cap Index was up only 2.28%.5 One would think that WTEMSC, which primarily invests in small-cap stocks, would be negatively affected by this bias in a poor environment for small caps, but the Index was able to overcome that headwind by a meaningful margin. 


In addition, similar to WTEMHY, WTEMSC had a standard deviation that was almost identical to that of the MSCI Emerging Markets Index (18.03% vs. 17.78%)—also proving that outsized volatility was not needed for the fund’s outsized excess returns.


2016: A Microcosm of Index Performance since Inception
 
It is easy for a fund family to cherry-pick and highlight years of good performance for their strategies, but in the case of these two Indexes, we do not believe that is necessary. Both Indexes began in 2007 and will receive their 10-year performance track records later this year (WTEMHY in June and WTEMSC in August), and while one year of strong performance is nice, a longer-term track record of strong performance is better. 


Since their respective inceptions, the WisdomTree Emerging Markets Indexes have outperformed the broad MSCI EM Index by 2.33% annualized, and  the EM SmallCap Dividend Index by 2.88%. But perhaps more importantly, both WisdomTree Indexes have managed this accomplishment with less volatility than the MSCI Emerging Markets Index.6 This impressive track record has validated what WisdomTree discovered at the 10-year anniversary of its domestic dividend suite in 2016: that a dividend-based approach works over time, across a number of different market caps and styles. 
 
WTEMHY Perf and Standard Deviation Since Inception


We believe emerging markets investors should look beyond the largest handful of EM strategies to those with the strongest long-term risk-adjusted numbers.


1Zephyr StyleADVISOR.
2Bloomberg, 1/3/17.
3Bloomberg.
4StyleADVISOR.
5Zephyr StyleADVISOR.
6Zephyr StyleADVISOR. WisdomTree Emerging Markets High Dividend Index performance and standard deviation measured from 6/1/07 to 12/31/16. WisdomTree Emerging Markets SmallCap Dividend Index performance and standard deviation measured from 8/1/2007 to 12/31/2016.


Important Risks Related to this Article

Investments in emerging, offshore or frontier markets are generally less liquid and less efficient than investments in developed markets and are subject to additional risks, such as risks of adverse governmental regulation and intervention or political developments.
For more investing insights, check out our Economic & Market Outlook

Tags

About the Contributor
josephtenaglia
Director, Model Portfolios
Joe Tenaglia joined WisdomTree as Asset Allocation Strategist in 2016. He is responsible for building model portfolios and creating custom solutions for portfolio managers and advisors. Joe sits on WisdomTree’s Model Portfolio Investment Committee, which manages the firm’s ETF model portfolios and helps shape and communicate WisdomTree’s thoughts on the markets. Prior to joining WisdomTree, he worked at Emerging Global Advisors as an Emerging Markets Portfolio Specialist and started his career at BNY Mellon. Joe graduated in 2009 from Boston College and is a holder of the Chartered Financial Analyst designation.