
Shifting Trends: From Low Volatility to Quality Dividend Growth


 For definitions of indexes in the chart, visit our glossary.
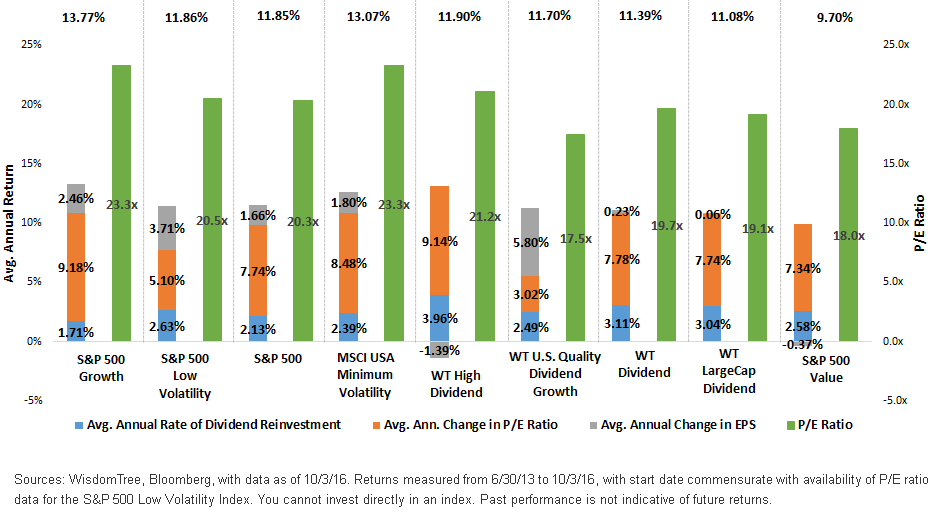
What “Won” over the Past Three Years?
At first glance, the returns are clustered together quite closely. The S&P 500 Growth Index led, with 13.77% per year. The S&P 500 Value Index was at the opposite end of the spectrum, but it was still up 9.70% per year.
The components of the total return decomposition were much more interesting than the headline numbers.
• Average Annual Rate of Dividend Reinvestment as a “Shock Absorber”: Of the indexes shown, the WisdomTree High Dividend Index was the standout, at 3.96%. Both the WisdomTree Dividend Index and the WisdomTree LargeCap Dividend Index were also above the 3.00% level. The S&P 500 Growth Index was the lowest, at 1.71%. This is significantly below the market (S&P 500 Index), which was at 2.13%.
• Average Annual Change in P/E Ratio: This component of the decomposition tells us that investors were willing to pay greater than 9.00% per year more for the earnings per share of the S&P 500 Growth Index over this period. Other indexes with similar P/E ratio expansion were the MSCI USA Minimum Volatility Index, which expanded at 8.48% per year, and the WisdomTree High Dividend Index, which expanded at 9.14% per year. The bottom line: these indexes have grown more expensive, and this has been a major driver of returns. Can they continue to get more expensive at a similar rate, relative to their earnings? That’s possible, yes, but each year of valuation expansion makes subsequent years of similar expansion more and more difficult.
• Average Annual Change in EPS: For most of the indexes shown, this was fairly low. The S&P 500 Index itself only saw the average annual change in EPS at 1.66% per year—the lowest of its three drivers. The real standout for this particular period was the WisdomTree U.S. Quality Dividend Growth Index, with EPS growth of 5.80% per year. This contributes to the fact that this Index also had the lowest P/E ratio of the indexes shown as of October 3, 2016, when measured on a trailing 12-month earnings basis.
What Could Be the Best Future Opportunity?
• Over long periods of time, the real return of equities has been fairly commensurate with their earnings yield. A higher earnings yield necessarily means a lower P/E ratio. Of the indexes shown, the WisdomTree U.S. Quality Dividend Growth Index had the lowest P/E ratio for this period.
• While the WisdomTree Indexes certainly saw P/E multiple expansion, albeit to varying degrees, it’s important to note that each has an annual rebalance that builds in a sensitivity relative valuation. Over time, the avenue to gaining greater weight in these indexes is through the growth of dividends—an important distinction to be made against indexes that may be weighted by market capitalization.
• Neither the MSCI USA Minium Volatility Index nor the S&P 500 Low Volatility Index has a rebalancing mechanism that builds in a sensitivity to relative valuation. While these indexes may not always become more and more expensive, any shift to lower valuation will not come from the rebalancing process.
• If the U.S. Federal Reserve embarks on a cycle of raising interest rates—even a slow cycle—then dividend-paying stocks such as those in the Utilities or Telecommunication Services sectors may face competition as sources of income. It’s worth noting that, as of this writing, the WisdomTree U.S. Quality Dividend Growth Index did not have exposure to these sectors, something that we think would surprise a lot of people about any dividend-focused index centered on U.S. equities.
Unless otherwise noted, data source is Bloomberg, as of 10/3/16.
For definitions of indexes in the chart, visit our glossary.
What “Won” over the Past Three Years?
At first glance, the returns are clustered together quite closely. The S&P 500 Growth Index led, with 13.77% per year. The S&P 500 Value Index was at the opposite end of the spectrum, but it was still up 9.70% per year.
The components of the total return decomposition were much more interesting than the headline numbers.
• Average Annual Rate of Dividend Reinvestment as a “Shock Absorber”: Of the indexes shown, the WisdomTree High Dividend Index was the standout, at 3.96%. Both the WisdomTree Dividend Index and the WisdomTree LargeCap Dividend Index were also above the 3.00% level. The S&P 500 Growth Index was the lowest, at 1.71%. This is significantly below the market (S&P 500 Index), which was at 2.13%.
• Average Annual Change in P/E Ratio: This component of the decomposition tells us that investors were willing to pay greater than 9.00% per year more for the earnings per share of the S&P 500 Growth Index over this period. Other indexes with similar P/E ratio expansion were the MSCI USA Minimum Volatility Index, which expanded at 8.48% per year, and the WisdomTree High Dividend Index, which expanded at 9.14% per year. The bottom line: these indexes have grown more expensive, and this has been a major driver of returns. Can they continue to get more expensive at a similar rate, relative to their earnings? That’s possible, yes, but each year of valuation expansion makes subsequent years of similar expansion more and more difficult.
• Average Annual Change in EPS: For most of the indexes shown, this was fairly low. The S&P 500 Index itself only saw the average annual change in EPS at 1.66% per year—the lowest of its three drivers. The real standout for this particular period was the WisdomTree U.S. Quality Dividend Growth Index, with EPS growth of 5.80% per year. This contributes to the fact that this Index also had the lowest P/E ratio of the indexes shown as of October 3, 2016, when measured on a trailing 12-month earnings basis.
What Could Be the Best Future Opportunity?
• Over long periods of time, the real return of equities has been fairly commensurate with their earnings yield. A higher earnings yield necessarily means a lower P/E ratio. Of the indexes shown, the WisdomTree U.S. Quality Dividend Growth Index had the lowest P/E ratio for this period.
• While the WisdomTree Indexes certainly saw P/E multiple expansion, albeit to varying degrees, it’s important to note that each has an annual rebalance that builds in a sensitivity relative valuation. Over time, the avenue to gaining greater weight in these indexes is through the growth of dividends—an important distinction to be made against indexes that may be weighted by market capitalization.
• Neither the MSCI USA Minium Volatility Index nor the S&P 500 Low Volatility Index has a rebalancing mechanism that builds in a sensitivity to relative valuation. While these indexes may not always become more and more expensive, any shift to lower valuation will not come from the rebalancing process.
• If the U.S. Federal Reserve embarks on a cycle of raising interest rates—even a slow cycle—then dividend-paying stocks such as those in the Utilities or Telecommunication Services sectors may face competition as sources of income. It’s worth noting that, as of this writing, the WisdomTree U.S. Quality Dividend Growth Index did not have exposure to these sectors, something that we think would surprise a lot of people about any dividend-focused index centered on U.S. equities.
Unless otherwise noted, data source is Bloomberg, as of 10/3/16.Important Risks Related to this Article
Dividends are not guaranteed, and a company currently paying dividends may cease paying dividends at any time.
Share & Comment
Popular Posts
Categories
Related Links
Christopher Gannatti began at WisdomTree as a Research Analyst in December 2010, working directly with Jeremy Schwartz, CFA®, Director of Research. In January of 2014, he was promoted to Associate Director of Research where he was responsible to lead different groups of analysts and strategists within the broader Research team at WisdomTree. In February of 2018, Christopher was promoted to Head of Research, Europe, where he was based out of WisdomTree’s London office and was responsible for the full WisdomTree research effort within the European market, as well as supporting the UCITs platform globally. In November 2021, Christopher was promoted to Global Head of Research, now responsible for numerous communications on investment strategy globally, particularly in the thematic equity space. Christopher came to WisdomTree from Lord Abbett, where he worked for four and a half years as a Regional Consultant. He received his MBA in Quantitative Finance, Accounting, and Economics from NYU’s Stern School of Business in 2010, and he received his bachelor’s degree from Colgate University in Economics in 2006. Christopher is a holder of the Chartered Financial Analyst Designation.