Become a Smarter ETF User: Look through the Wrapper


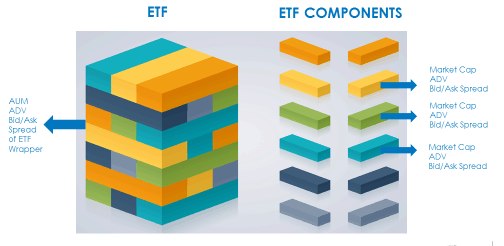
 Each building block has its own market cap, its own ADV and its own bid/ask spread. As a former market maker, I can tell you that I used all those underlying characteristics when valuing any ETF. The building blocks are so important that the market-making community uses daily files with all the ETF components from the issuers as the primary foundation to price all ETFs. Shouldn’t investors also consider these underlying basket characteristics when evaluating ETFs for investment?
Assets Under Management
Let’s start with assets under management and use EPS, the WisdomTree Earnings 500 Fund, as a case study. As of August 23, 2016, EPS had $121 million in AUM and included 485 large-cap U.S. stocks. If an investor wanted to buy $50 million of this Fund, they would go to the market to execute that transaction, and the market maker would funnel those assets right back to the ETF itself and create new shares. In the end, EPS would have $171 million in AUM and the $50 million investment would be 29% of the Fund.
But let’s step back and think about what the investor really owns. Each of those building blocks has a market capitalization. Currently, the total market cap of those 485 large-cap U.S. stocks represents over $19 trillion. So a $50 million investment isn’t 29% of the AUM, it’s really .0003% of the assets that are tied to the ETF basket. AUM of the ETF wrapper tells you how many people are investing in that group of securities but not how much money is tied to the securities in the Fund.
Average Daily Volume
Average daily volume does not equal the liquidity capacity of an ETF. The ETF represents an investment strategy. Volume in the secondary markets (the on-screen markets) is measuring how many people want to buy and sell that strategy on a daily basis. On-screen volume of the ETF is measuring demand but not supply. Supply of an ETF is sourced from all the layers of liquidity below.
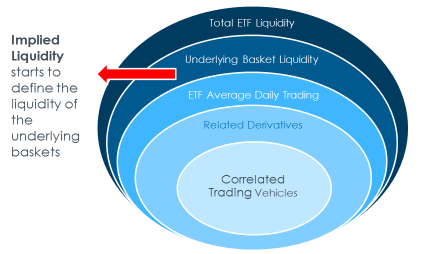
The Sum of ETF Liquidity Layers = Liquidity Capacity
 When a market maker sells an ETF, they can buy something from any one of these categories to balance out their position or hedge themselves. The first layer is the liquidity of the underlying basket. This is the sum of the ADV of all those building blocks. Next is the ADV of the ETF itself, which is additive to the liquidity of the underlying basket. Additionally, we have related derivatives such as futures, and correlated trading vehicles such as ADRs and other ETFs. The liquidity capacity of an ETF is defined by adding up all these layers to represent how much an ETF can trade or how much liquidity a market maker can transfer to the ETF for any investor. To quantify the liquidity capacity, we have the ADV of the ETF, and now we also have ETF implied liquidity, which starts to define the underlying basket liquidity. ETF implied liquidity tells us how many ETF shares we can trade through the underlying basket over one day without price impact. Implied liquidity figures for WisdomTree equity ETFs can be found on our website. ETF implied liquidity is a powerful tool to assess the potential liquidity of an ETF.
Bid/Ask Spread
Finally, the last metric is the spread of an ETF. The spread is based on the costs to hedge. If a market maker sells an ETF, they have to buy something to hedge their position. They will usually buy the underlying basket, and so the bid/ask spread of all the underlying securities in the ETF basket will first help define the initial width of the spread of an ETF. It’s important to note that any wrapper, such as mutual funds, swaps, structured products, etc., based on the same exposure has to pay these costs as well. The ETF spread just makes these costs transparent. For a more in-depth discussion on how spreads are constructed, read here. So before judging a spread of an ETF, it’s important to know what we’re judging it against: it’s a function of cost, and that cost will have to be paid regardless of the wrapper we choose.
The bottom line: Investors should look through the ETF wrapper and take into consideration the characteristics of the underlying building blocks in addition to that of the ETF itself. This can provide a much more accurate picture of what the ETF can do versus what the ETF has done in the past, and open up a whole new subset of ETF tools available to investors.
Important Risks Related to this Article
There are risks associated with investing, including possible loss of principal. Funds focusing their investments on certain sectors increase their vulnerability to any single economic or regulatory development. This may result in greater share price volatility. Please read the Fund’s prospectus for specific details regarding the Fund’s risk profile.


