
Recent Trends in U.S. Dividends and Buybacks


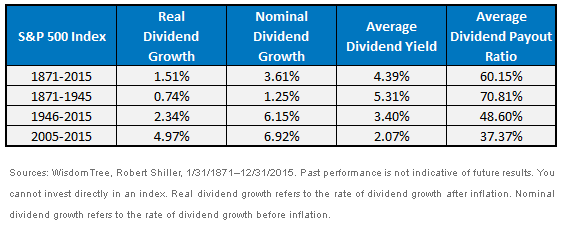 Looking at just the current dividend yield of 2.07% could imply that the market is “expensive” because it is below the average 4.4% dividend yield of the markets since 1871. This might be the case if firms were not altering the way they return money to shareholders (i.e., through increased share buybacks).
Looking at the combined dividend yield and net buyback yield, or shareholder yield, might tell a different story about valuations. Whether these lower dividend payout ratios (higher retained earnings or higher buybacks) are wasted or in fact lead to higher earnings and dividend growth is key to the debate about future returns on the market.
The evidence shows that over long periods, a decreased dividend payout ratio has led to increased earnings and dividend growth.
Prior to 1946, the average payout ratio was more than 70% and dividend yields averaged 5.3%, but real (after-inflation) dividend growth was only 0.74%.2
After 1946, when the payout ratio decreased from more than 70% to less than 50%—leading to a reduction in the average dividend yield to 3.4%—real dividend growth increased to 2.3%, a pickup of 1.6%.3
Over the last 15 years, firms increasingly have been using share buybacks as a method of returning cash to shareholders.
• As of December 31, 1999, dividends and gross share buybacks were roughly equal, at around $140 billion each.
• But as of December 31, 2015, firms distributed to shareholders $572 billion of gross share buybacks and $382 billion of dividends over the previous 12 months.4
But not all buybacks should be counted the same. Some companies buy back stock only to offset the dilution of shares that results from share issuance. What has an impact on future earnings and dividend growth are the buybacks that reduce total shares outstanding, as these buybacks impact per-share earnings and dividend distributions in the future, assuming a constant level of aggregate dividends being distributed or earnings generated.
WisdomTree has an earnings-weighted Index of the U.S. markets, called the WisdomTree Earnings Index, that covers more than 2,000 stocks and provides a good cross-section of the capital allocation plans of companies in the U.S.
WisdomTree has been tracking the performance and fundamentals of these profitable companies since early 2007, the Index’s inception.
WisdomTree Earnings Index Buybacks
Looking at just the current dividend yield of 2.07% could imply that the market is “expensive” because it is below the average 4.4% dividend yield of the markets since 1871. This might be the case if firms were not altering the way they return money to shareholders (i.e., through increased share buybacks).
Looking at the combined dividend yield and net buyback yield, or shareholder yield, might tell a different story about valuations. Whether these lower dividend payout ratios (higher retained earnings or higher buybacks) are wasted or in fact lead to higher earnings and dividend growth is key to the debate about future returns on the market.
The evidence shows that over long periods, a decreased dividend payout ratio has led to increased earnings and dividend growth.
Prior to 1946, the average payout ratio was more than 70% and dividend yields averaged 5.3%, but real (after-inflation) dividend growth was only 0.74%.2
After 1946, when the payout ratio decreased from more than 70% to less than 50%—leading to a reduction in the average dividend yield to 3.4%—real dividend growth increased to 2.3%, a pickup of 1.6%.3
Over the last 15 years, firms increasingly have been using share buybacks as a method of returning cash to shareholders.
• As of December 31, 1999, dividends and gross share buybacks were roughly equal, at around $140 billion each.
• But as of December 31, 2015, firms distributed to shareholders $572 billion of gross share buybacks and $382 billion of dividends over the previous 12 months.4
But not all buybacks should be counted the same. Some companies buy back stock only to offset the dilution of shares that results from share issuance. What has an impact on future earnings and dividend growth are the buybacks that reduce total shares outstanding, as these buybacks impact per-share earnings and dividend distributions in the future, assuming a constant level of aggregate dividends being distributed or earnings generated.
WisdomTree has an earnings-weighted Index of the U.S. markets, called the WisdomTree Earnings Index, that covers more than 2,000 stocks and provides a good cross-section of the capital allocation plans of companies in the U.S.
WisdomTree has been tracking the performance and fundamentals of these profitable companies since early 2007, the Index’s inception.
WisdomTree Earnings Index Buybacks
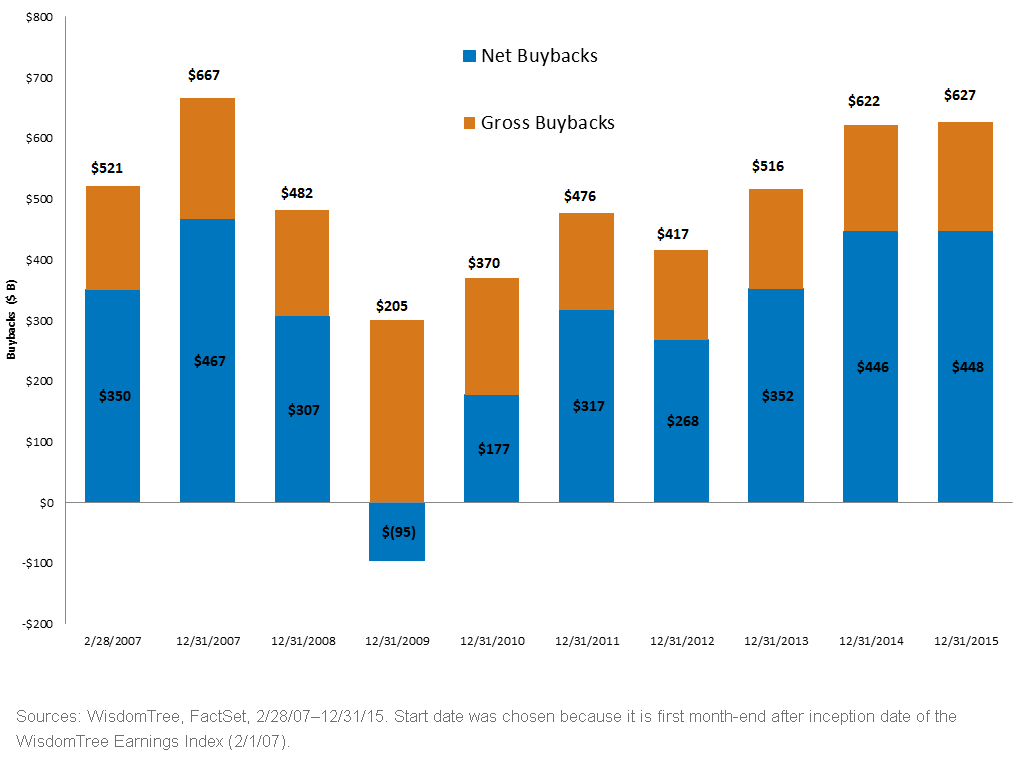 The unmistakable conclusion from the last few years of stock buyback data is that buybacks are having an impact on reducing shares outstanding. Impressively, since the calendar-year bottom in 2009, buybacks have tripled from $205 billion to $627 billion, and net buybacks have increased by more than $540 billion. Since February 2007, total gross buybacks have grown from $521 billion to $627 billion, and net buybacks have grown from $350 billion to $448 billion.
As of December 31, 2015, only 14% of the WisdomTree Earnings Index’s weight was in companies that increased shares outstanding over the previous 12 months; the other 86% either reduced shares outstanding or kept them constant. Over the last five years, on average, around 74% of the Index weight was in companies that had a positive net buyback yield (or reduced shares outstanding). Even more impressive, over the same period, around 47% of the Index weight was in companies that reduced shares outstanding by 2% or more.
We believe investors should look at the increased share buyback of corporate America as a positive for future returns. Assuming no change in revenue or profitability (i.e., a consistent Earnings Stream®), these net share buybacks are essentially “locking in” a certain level of earnings-per-share growth by reducing shares outstanding. Taken a step further, assuming no change in valuation (i.e., a constant price-to-earnings ratio [P/E]), the price of a security would have to increase by the same percentage as its earnings-per-share growth to keep the P/E ratio constant.
1Sources: WisdomTree, Robert Shiller. Refers to the S&P 500 Index from 1926 to present and a similar U.S. market equivalent prior to 1926.
2Sources: WisdomTree, Robert Shiller.
3Note: Since there was a structural shift down in dividend payout ratio, it is not surprising the real dividend growth is greater than the reduction in dividend yield.
4Source: Standard & Poor’s, as of 12/31/15.
The unmistakable conclusion from the last few years of stock buyback data is that buybacks are having an impact on reducing shares outstanding. Impressively, since the calendar-year bottom in 2009, buybacks have tripled from $205 billion to $627 billion, and net buybacks have increased by more than $540 billion. Since February 2007, total gross buybacks have grown from $521 billion to $627 billion, and net buybacks have grown from $350 billion to $448 billion.
As of December 31, 2015, only 14% of the WisdomTree Earnings Index’s weight was in companies that increased shares outstanding over the previous 12 months; the other 86% either reduced shares outstanding or kept them constant. Over the last five years, on average, around 74% of the Index weight was in companies that had a positive net buyback yield (or reduced shares outstanding). Even more impressive, over the same period, around 47% of the Index weight was in companies that reduced shares outstanding by 2% or more.
We believe investors should look at the increased share buyback of corporate America as a positive for future returns. Assuming no change in revenue or profitability (i.e., a consistent Earnings Stream®), these net share buybacks are essentially “locking in” a certain level of earnings-per-share growth by reducing shares outstanding. Taken a step further, assuming no change in valuation (i.e., a constant price-to-earnings ratio [P/E]), the price of a security would have to increase by the same percentage as its earnings-per-share growth to keep the P/E ratio constant.
1Sources: WisdomTree, Robert Shiller. Refers to the S&P 500 Index from 1926 to present and a similar U.S. market equivalent prior to 1926.
2Sources: WisdomTree, Robert Shiller.
3Note: Since there was a structural shift down in dividend payout ratio, it is not surprising the real dividend growth is greater than the reduction in dividend yield.
4Source: Standard & Poor’s, as of 12/31/15. Share & Comment
Popular Posts
Categories
Related Links
Jeremy Schwartz has served as our Global Chief Investment Officer since November 2021 and leads WisdomTree’s investment strategy team in the construction of WisdomTree’s equity Indexes, quantitative active strategies and multi-asset Model Portfolios. Jeremy joined WisdomTree in May 2005 as a Senior Analyst, adding Deputy Director of Research to his responsibilities in February 2007. He served as Director of Research from October 2008 to October 2018 and as Global Head of Research from November 2018 to November 2021. Before joining WisdomTree, he was a head research assistant for Professor Jeremy Siegel and, in 2022, became his co-author on the sixth edition of the book Stocks for the Long Run. Jeremy is also co-author of the Financial Analysts Journal paper “What Happened to the Original Stocks in the S&P 500?” He received his B.S. in economics from The Wharton School of the University of Pennsylvania and hosts the Wharton Business Radio program Behind the Markets on SiriusXM 132. Jeremy is a member of the CFA Society of Philadelphia.