Managing Valuation Risk in India’s Equities


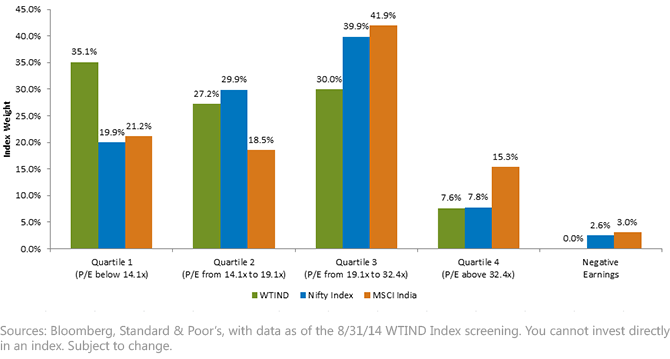
 • More Weight to Lower-Priced Stocks – The WisdomTree India Earnings Index has over 60% of its weight in the two lowest-priced quartiles, which is significantly more than the Nifty or MSCI India indexes. There is a natural tendency of earnings-weighted approaches to reduce weight to stocks whose prices have appreciated at a faster rate than their earnings, and concurrently to increase weight to stocks that have fallen in price despite exhibiting positive earnings growth.
• Less Weight to Higher-Priced Stocks – On the other hand, WisdomTree’s approach has less than 40% of its weight going to the two higher-priced P/E quartiles. The MSCI India Index has over 40% of its weight in the second most expensive quartile alone.
• Negative Earnings and Speculative Stocks – Although profitability may fluctuate throughout the year, at each annual rebalance WisdomTree requires companies to be profitable before inclusion. This requirement keeps the weight to firms that we feel tend to be more speculative and of lower quality at zero. Neither of the market cap-weighted indexes above shares this requirement, but it is worth noting that they focus on large-cap stocks, which have a higher tendency to deliver positive cumulative profits.
1Source: Bloomberg, as of 8/31/2014.
2References the WisdomTree Equity Income Index.
3References the WisdomTree LargeCap Dividend Index.
4References the WisdomTree U.S. Dividend Growth Index.
 Important Risks Related to this Article
Investments in emerging, offshore or frontier markets are generally less liquid and less efficient than investments in developed markets and are subject to additional risks, such as risks of adverse governmental regulation and intervention or political developments. Investments focused in India are increasing the impact of events and developments associated with the region, which can adversely affect performance.

Christopher Gannatti began at WisdomTree as a Research Analyst in December 2010, working directly with Jeremy Schwartz, CFA®, Director of Research. In January of 2014, he was promoted to Associate Director of Research where he was responsible to lead different groups of analysts and strategists within the broader Research team at WisdomTree. In February of 2018, Christopher was promoted to Head of Research, Europe, where he was based out of WisdomTree’s London office and was responsible for the full WisdomTree research effort within the European market, as well as supporting the UCITs platform globally. In November 2021, Christopher was promoted to Global Head of Research, now responsible for numerous communications on investment strategy globally, particularly in the thematic equity space. Christopher came to WisdomTree from Lord Abbett, where he worked for four and a half years as a Regional Consultant. He received his MBA in Quantitative Finance, Accounting, and Economics from NYU’s Stern School of Business in 2010, and he received his bachelor’s degree from Colgate University in Economics in 2006. Christopher is a holder of the Chartered Financial Analyst Designation.

