Current Valuations Suggest Greater Resiliency across Emerging Market (EM) Debt


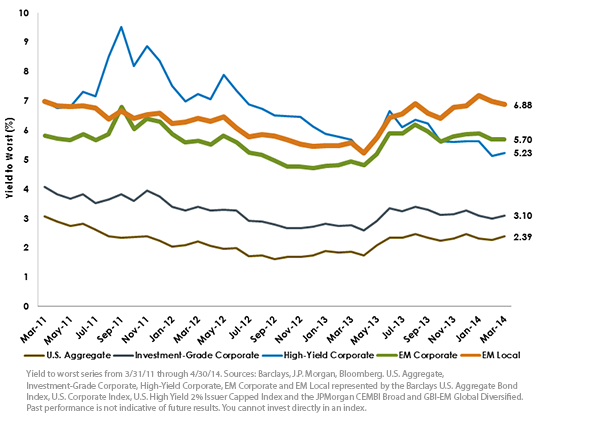
 For definitions of terms and indexes in the chart, please visit our Glossary.
U.S. high-yield corporate and EM local debt might not be natural substitutes and involve different risk factors, such as local investor preferences and the assumption of non-U.S. currency risk in local debt. But in a yield-starved environment, picking up nearly 160 bps with an investment-grade portfolio remains compelling in our view.6 Over the longer term, we believe that these valuations will encourage many investors to take an opportunistic look at the costs, benefits and merits of these exposures.
A Comparison of Corporate Debt
Emerging market corporate debt may be seen as a more straightforward comparison for some. Both U.S. high-yield and EM corporate bonds are denominated in U.S. dollars. As such, both markets trade at a spread relative to U.S. Treasuries in order to compensate investors for taking on credit risk. EM corporate bonds are slightly longer in duration than high-yield bonds in aggregate, but are overwhelmingly (70%) composed of investment-grade issuers versus a, by definition, 100% speculative-grade portfolio.7 Given that these companies are headquartered in emerging markets, investors are compensated by an additional 64 bps in yield over high-yield corporate bonds, even though they represent higher-credit-quality businesses. Additionally, EM corporates feature only about 5% of overlap with the U.S. investment-grade and high-yield corporate universe.8
Given the potential for geopolitical risk, a discussion of emerging market corporate debt would not be complete without acknowledging the impact the current crisis has had on Russian corporate borrowing costs. Russian allocations within EM corporates may understandably give pause to some investors. However, after a de-escalation in tensions in recent days, markets appear to be trading more favorably. Coupled with the fact that nearly all of these businesses pose strategic long-term importance to the global economy, we continue to view the current difficulties as a long-term buying opportunity for active managers.
Stratifying Opportunities across Credit Ratings
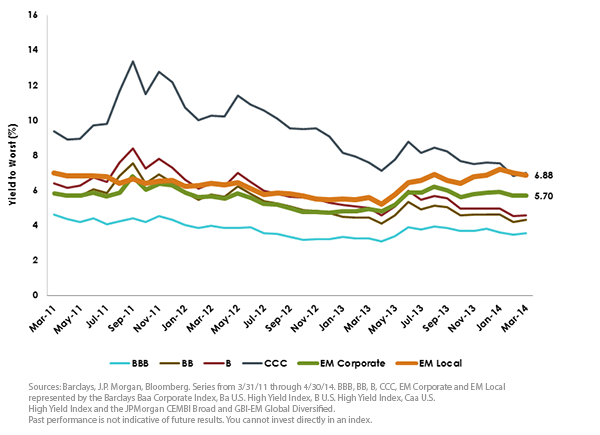
In seeking to further refine our assessment of potential opportunities in emerging market fixed income, we sought to graph opportunities in U.S. corporate bonds yields according solely to their credit ratings.9 While this analysis gives a high degree of discretion to credit rating agencies, we believe this analysis meaningfully highlights the dramatic transformation we have seen in markets over the past year. In April 2013, U.S. CCC-rated corporate bonds yielded 190 bps more than EM local debt. At the end of April 2014, EM local sovereign debt offered an additional 9 bps in yield compared to CCC-rated corporate borrowers, a shift of nearly 200 bps. Prior to 2014, local debt had never offered, even during the depths of the financial crisis, more yield than CCC-rated corporates in the history of the J.P. Morgan GBI-EM Global Diversified Index.10
Conducting this same analysis for EM corporates, this EM asset class now yields over 110 bps more than B-rated credits in the U.S. In April 2013, the premium was only 20 bps, and at the start of 2013, B-rated high-yield debt actually provided higher absolute yields. Again, the key takeaway from the chart below is that across virtually every measure of relative value, EM debt currently provides a compelling pickup in income potential compared to lower-rated U.S. corporate debt. Additionally, while yields have continued to fall since August 2013 in the U.S., yields of emerging market fixed income have continued to climb over the last six months, potentially creating attractive relative value opportunities.
EM Locals Trading Like CCC-Rated Corporates, EM Corporates Wider Than B-Rated Corporates
 For definitions of terms and indexes in the chart, please visit our Glossary.
Conclusion
While emerging market investing entails a potentially different risk profile compared to U.S. corporate debt, we believe that when investors are looking globally for income in their portfolios, all asset classes should be on the table. In the current market environment, we believe that emerging market fixed income is priced attractively compared to other risky fixed income sectors. Compared to last year, valuations suggest a greater resiliency to weather a potential rise in global interest rates. In our view, fundamentals suggest a potential margin for error as well.
1Emerging market local debt is proxied by the J.P. Morgan GBI-EM Global Diversified. EM corporate debt is proxied by the JPMorgan CEMBI Broad. All data as of 4/30/14 unless otherwise noted
2Source: JP Morgan
3Sources: JP Morgan, Bloomberg
4As represented by Barclays High Yield
5Source: JP Morgan
6Source: JP Morgan. As of 4/30/14, the J.P. Morgan GBI-EM Global Diversified Index was 93% investment grade
7Source: JP Morgan
8Sources: Barclays, WisdomTree
9Analysis was completed by using the Barclays indices for each credit rating
10Source: JP Morgan. Real-time history of the index begins in December 2006
For definitions of terms and indexes in the chart, please visit our Glossary.
Conclusion
While emerging market investing entails a potentially different risk profile compared to U.S. corporate debt, we believe that when investors are looking globally for income in their portfolios, all asset classes should be on the table. In the current market environment, we believe that emerging market fixed income is priced attractively compared to other risky fixed income sectors. Compared to last year, valuations suggest a greater resiliency to weather a potential rise in global interest rates. In our view, fundamentals suggest a potential margin for error as well.
1Emerging market local debt is proxied by the J.P. Morgan GBI-EM Global Diversified. EM corporate debt is proxied by the JPMorgan CEMBI Broad. All data as of 4/30/14 unless otherwise noted
2Source: JP Morgan
3Sources: JP Morgan, Bloomberg
4As represented by Barclays High Yield
5Source: JP Morgan
6Source: JP Morgan. As of 4/30/14, the J.P. Morgan GBI-EM Global Diversified Index was 93% investment grade
7Source: JP Morgan
8Sources: Barclays, WisdomTree
9Analysis was completed by using the Barclays indices for each credit rating
10Source: JP Morgan. Real-time history of the index begins in December 2006Important Risks Related to this Article
Investments in emerging, offshore or frontier markets are generally less liquid and less efficient than investments in developed markets and are subject to additional risks, such as risks of adverse governmental regulation and intervention or political developments. Foreign investing involves special risks, such as risk of loss from currency fluctuation or political or economic uncertainty. Fixed income investments are subject to interest rate risk; their value will normally decline as interest rates rise. In addition, when interest rates fall, income may decline. Fixed income investments are also subject to credit risk, the risk that the issuer of a bond will fail to pay interest and principal in a timely manner or that negative perceptions of the issuer’s ability to make such payments will cause the price of that bond to decline.

Rick Harper serves as the Chief Investment Officer, Fixed Income and Model Portfolios at WisdomTree Asset Management, where he oversees the firm’s suite of fixed income and currency exchange-traded funds. He is also a voting member of the WisdomTree Model Portfolio Investment Committee and takes a leading role in the management and oversight of the fixed income model allocations. He plays an active role in risk management and oversight within the firm.
Rick has over 29 years investment experience in strategy and portfolio management positions at prominent investment firms. Prior to joining WisdomTree in 2007, Rick held senior level strategist roles with RBC Dain Rauscher, Bank One Capital Markets, ETF Advisors, and Nuveen Investments. At ETF Advisors, he was the portfolio manager and developer of some of the first fixed income exchange-traded funds. His research has been featured in leading periodicals including the Journal of Portfolio Management and the Journal of Indexes. He graduated from Emory University and earned his MBA at Indiana University.

