The content of this post is relevant to institutional investors interested in trading ETFs in significant size. Individual investors do not always have access to liquidity providers to trade ETFs as referenced below.
Exchange-traded funds (
ETFs) are often criticized for their perceived
illiquidity, especially when looking at
“size on the screen.” Ten years ago, it was much more difficult to execute large blocks in ETFs. At that time there were really only a few large-block
liquidity providers, typically bank trading desks. It was also a time when trading underlying holdings of an ETF in hard-to-access markets was difficult and expensive. Now, however, the market has evolved drastically and there are a wide variety of liquidity providers willing to make
very large-size markets in the broad spectrum of ETFs. A recent example is an $85 million block in an emerging market local debt ETF.
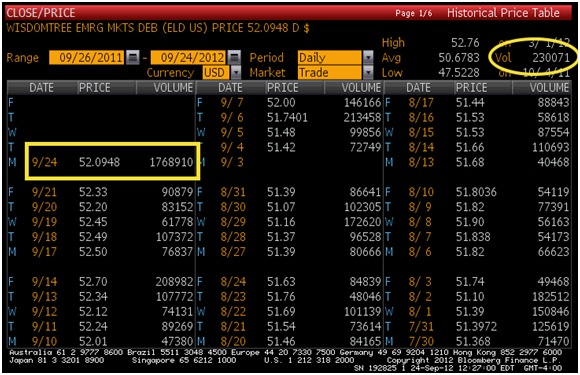
The screenshot below shows a
Bloomberg historical price table for the Fund. I have highlighted the
average daily volume (ADV) in a yellow circle—230,071 shares per day. In the yellow square you can see that on September 24 (as of 12:38pm) the fund traded 1,768,910 shares, significantly more than the ADV.

Source: Bloomberg. For illustrative purposes only.
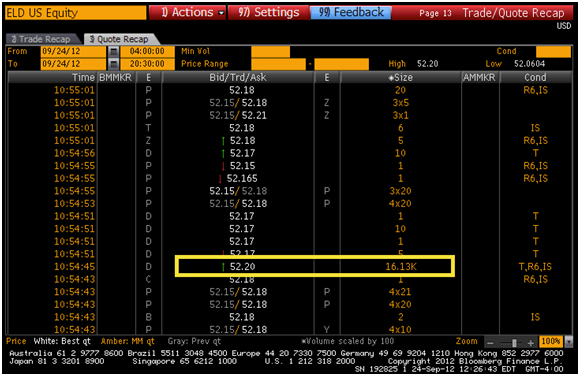
The next screenshot shows the Bloomberg trade/quote recap screen, which shows scrolling quotes and actual trades throughout each day. In the yellow square I have highlighted a block trade of 1,613,000 shares at a price of $52.20 that took place at 10:54:45 a.m. on September 24, 2012. If you look further down the screen, you can see that the quoted market at the time of the print was $52.15 bid and $52.18 offered with very little size shown. So the trade took place just above the displayed market.

Source: Bloomberg. For illustrative purposes only.
The final screenshot shows the level-two quote screen for the same Fund. This indicates the bids and offers and sizes available beyond the inside market. You can see that at 12:38 p.m. there were only 11,000 shares (yellow circle) offered up to $52.20.

Source: Bloomberg. For illustrative purposes only.
This light volume on the order book is typical of many ETFs. There is a lot of liquidity available from the community of liquidity providers, but they do not post the available liquidity electronically, so the order books look very thin. In the current market regulatory environment, many ETF liquidity providers do not post markets electronically in size. This is why it has become critical in the ETF market to develop a relationship with a variety of liquidity providers who can handle your large-block trades, regardless of what the average daily volume and the order book look like on your quote screens. Don’t let average daily volumes limit your use of the wide variety of ETFs. Spend the time and energy necessary to understand ways to effectively trade the products.


 Source: Bloomberg. For illustrative purposes only.
The next screenshot shows the Bloomberg trade/quote recap screen, which shows scrolling quotes and actual trades throughout each day. In the yellow square I have highlighted a block trade of 1,613,000 shares at a price of $52.20 that took place at 10:54:45 a.m. on September 24, 2012. If you look further down the screen, you can see that the quoted market at the time of the print was $52.15 bid and $52.18 offered with very little size shown. So the trade took place just above the displayed market.
 Source: Bloomberg. For illustrative purposes only.
The final screenshot shows the level-two quote screen for the same Fund. This indicates the bids and offers and sizes available beyond the inside market. You can see that at 12:38 p.m. there were only 11,000 shares (yellow circle) offered up to $52.20.
 Source: Bloomberg. For illustrative purposes only.
This light volume on the order book is typical of many ETFs. There is a lot of liquidity available from the community of liquidity providers, but they do not post the available liquidity electronically, so the order books look very thin. In the current market regulatory environment, many ETF liquidity providers do not post markets electronically in size. This is why it has become critical in the ETF market to develop a relationship with a variety of liquidity providers who can handle your large-block trades, regardless of what the average daily volume and the order book look like on your quote screens. Don’t let average daily volumes limit your use of the wide variety of ETFs. Spend the time and energy necessary to understand ways to effectively trade the products.

